Re-hosting (also referred to as lift and shift) is a common migration use case. Re-architecture and Re-platform are steps that break the traditional architectures and replace individual components with cloud services and microservices.
For this lab you are going to use an updated version of the application on a Kubernetes. This makes it easy for you to see the transformation of the Sample Application in Lab 1 and the value of running Kubernetes on AWS without needing to stand up or maintain your own Kubernetes control plane.
💥💥💥 Notice 💥💥💥
If you would rather NOT provision Kubernetes on AWS, then please follow the AWS Lab 2 - Modernization with Containers workshop guide. This guide has a shorter setup process but, still allows you to interact with the sames transformed application.
💥💥💥 Notice 💥💥💥
This lab assumed you already provisioned an Amazon Elastic Kubernetes Service (EKS) cluster. If you did not have a cluster, then return the Kubernetes Lab.
Objectives of this Lab
🔷 Install the Dynatrace Operator and sample application
🔷 Review how the sample application went from a simple architecture to multiple services
🔷 Examine the transformed application using service flows and back traces
For this lab, another version of the application exists that breaks out each of these backend services into separate services. By putting these services into Docker images, we gain the ability to deploy the service into modern platforms like Kubernetes and AWS services.
Kubernetes Overview
Kubernetes is open source software that allows you to deploy and manage containerized applications at scale.
Kubernetes manages clusters of compute instances and runs containers on those instances with processes for deployment, maintenance, and scaling. Using Kubernetes, you can run any type of containerized applications using the same toolset on-premises and in the cloud.
You can read more about Kubernetes here
Amazon Elastic Kubernetes Service
AWS makes it easy to run Kubernetes. You can choose to manage Kubernetes infrastructure yourself with Amazon EC2 or get an automatically provisioned, managed Kubernetes control plane with Amazon EKS. Either way, you get powerful, community-backed integrations to AWS services like VPC, IAM, and service discovery as well as the security, scalability, and high-availability of AWS.
Amazon EKS runs Kubernetes control plane instances across multiple Availability Zones to ensure high availability. Amazon EKS automatically detects and replaces unhealthy control plane instances, and it provides automated version upgrades and patching for them.
Amazon EKS is also integrated with many AWS services to provide scalability and security for your applications, including the following:
- Elastic Load Balancing for load distribution
- IAM for authentication
- Amazon VPC for isolation
- Amazon ECR for container images
Refer to the picture below, here are the components for lab 2.

#1 . Sample Application Sample app representing a "services" architecture of a frontend and multiple backend services implemented as Docker containers that we will review in this lab.
#2 . Kubernetes Amazon Elastic Kubernetes Service (EKS) is hosting the application. The Kubernetes cluster had the Dynatrace OneAgent Operator installed. (see below for more details). Two EKS nodes make up the Kubernetes cluster. The Dynatrace OneAgent was preinstalled by the OneAgent operator and is sending data to your Dynatrace SaaS environment. (see below for more details)
#3 . Dynatrace Operator Dynatrace OneAgent is container-aware and comes with built-in support for out-of-the-box monitoring of Kubernetes. Dynatrace supports full-stack monitoring for Kubernetes, from the application down to the infrastructure layer.
#4 . Dynatrace Dynatrace tenant where monitoring data is collected and analyzed.
#5 . Full-Stack Dashboard Made possible by the Dynatrace OneAgent that will automatically instrument each running node & pod in EKS.
#6 . Kubernetes Dashboard The Kubernetes page provides an overview of all Kubernetes clusters showing monitoring data like the clusters' sizing and utilization.
One key Dynatrace advantage is ease of activation. OneAgent technology simplifies deployment across large enterprises and relieves engineers of the burden of instrumenting their applications by hand. As Kubernetes adoption continues to grow, it becomes more important than ever to simplify the activation of observability across workloads without sacrificing the deployment automation that Kubernetes provides. Observability should be as cloud-native as Kubernetes itself.
In our workshop, we will install the Dynatrace Operator that streamlines lifecycle management. You can read more about it here in this Dynatrace blog.
Organizations will often customize the Dynatrace Operator installation and you can read more about the options in the Dynatrace docs but, we are going to use a single command that we can get from the Dynatrace interface to show how easy it is to get started.
To verify completion status of the CloudFormation script within the AWS console.
You can navigate to the CloudFormation page as shown below. 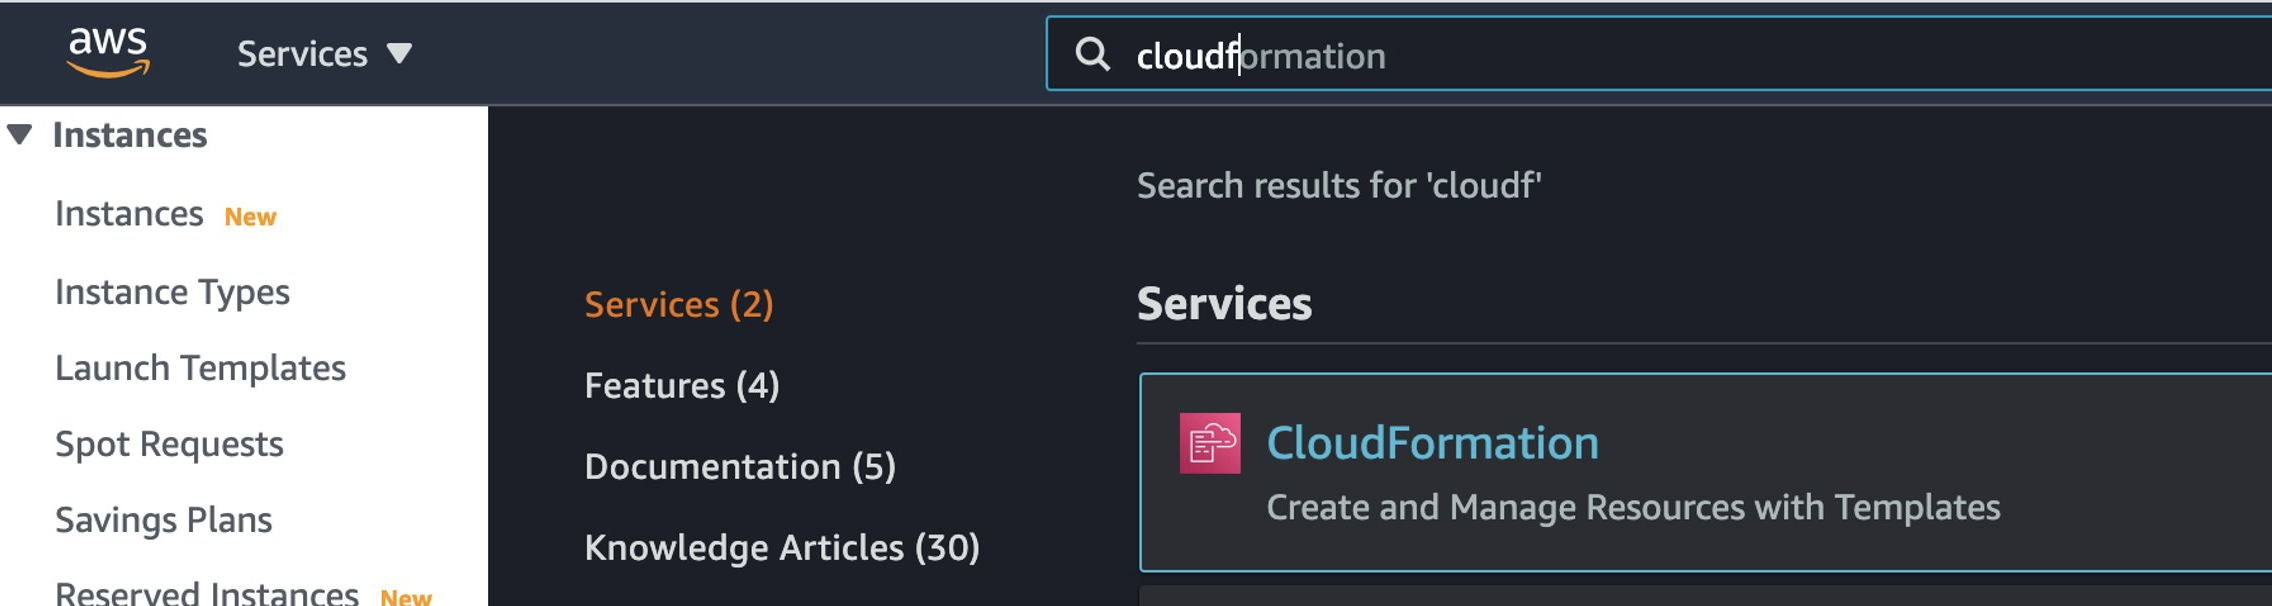
Or use this link as shortcut to the CloudFormation page
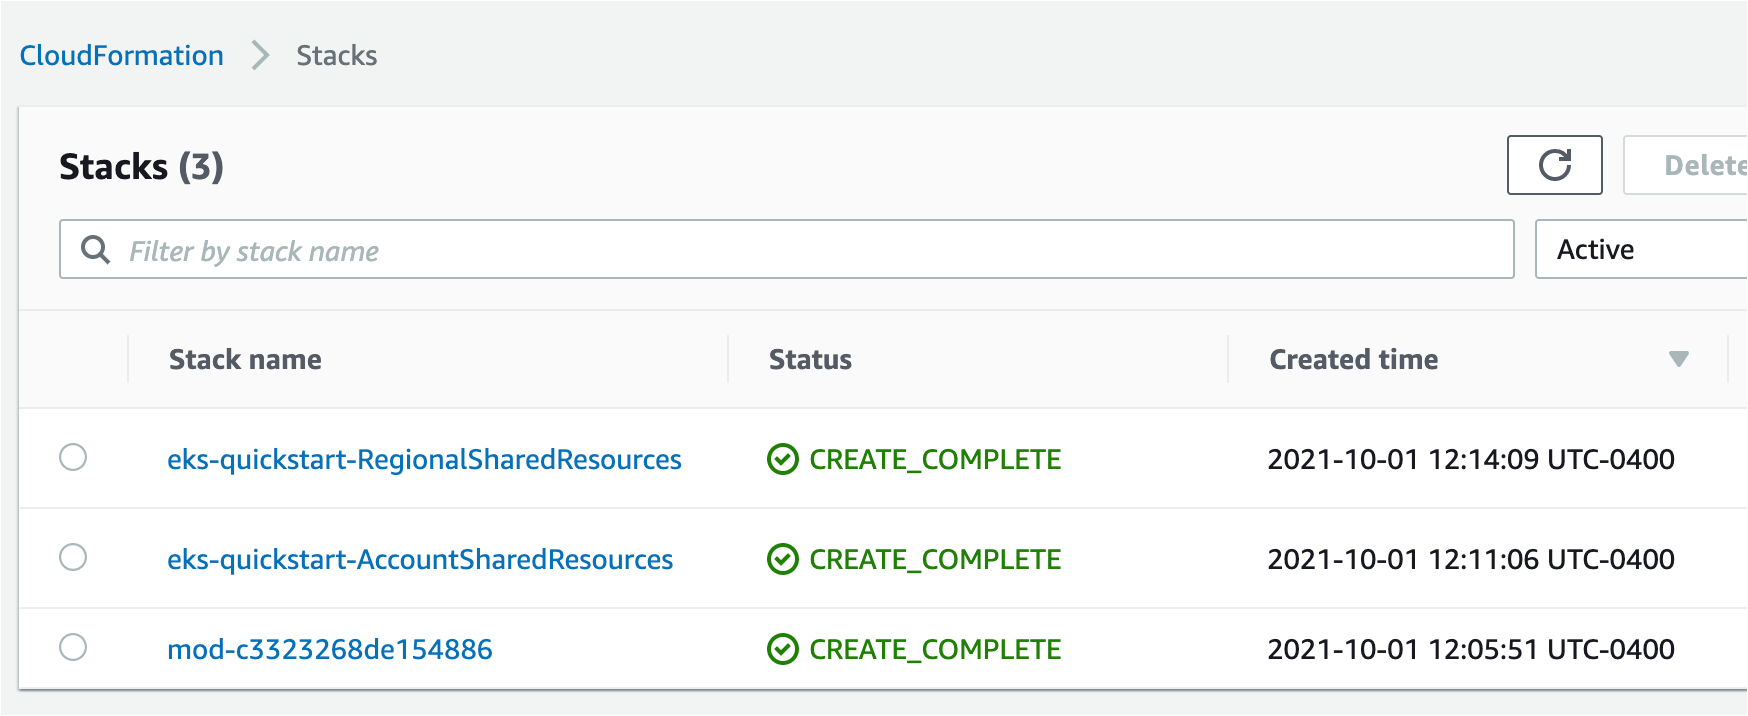
On the CloudFormation page, click on the stack shown in this example below.
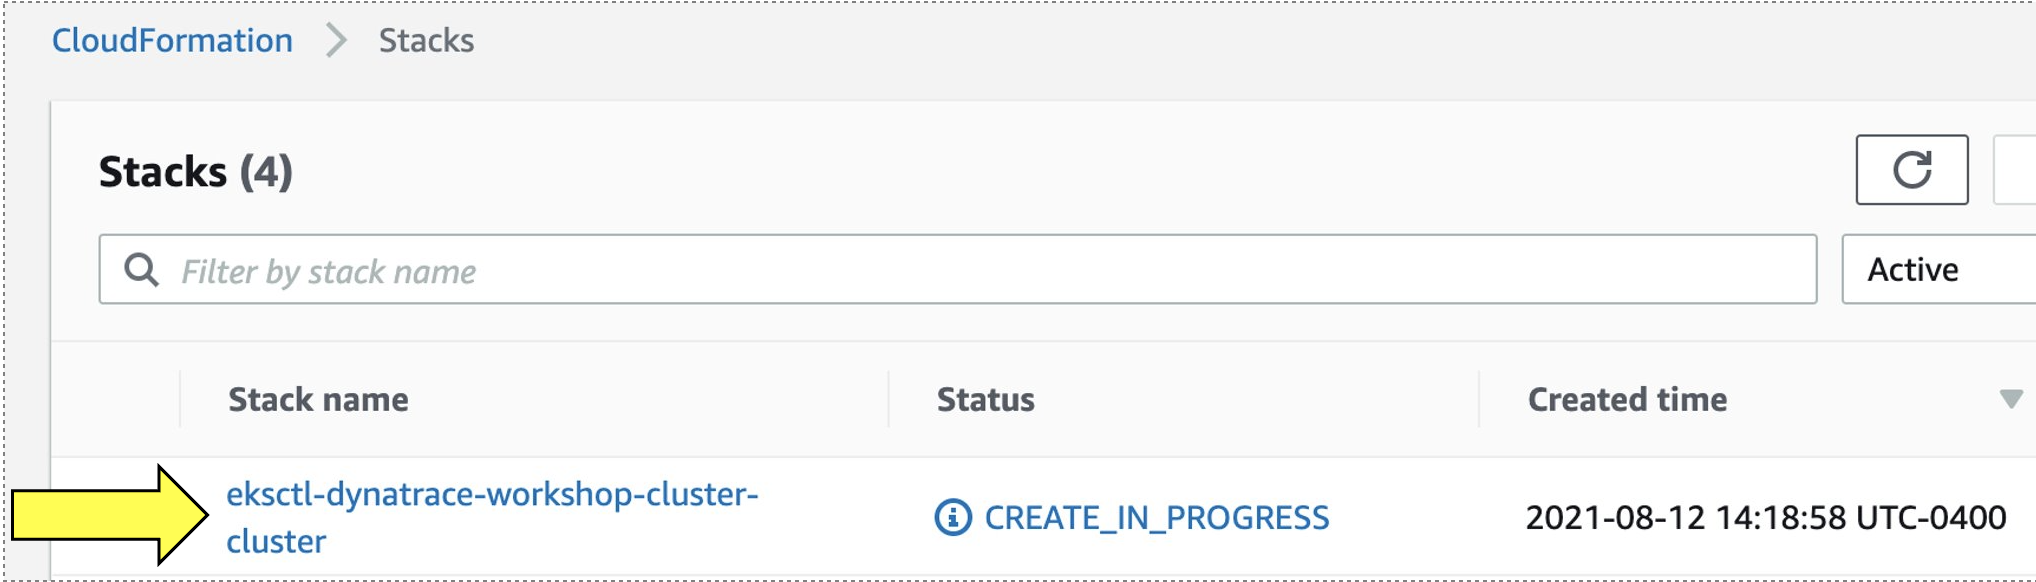
Then click on Events to see the provisioning steps. As it processes, the statuses will start to show CREATE_COMPLETE
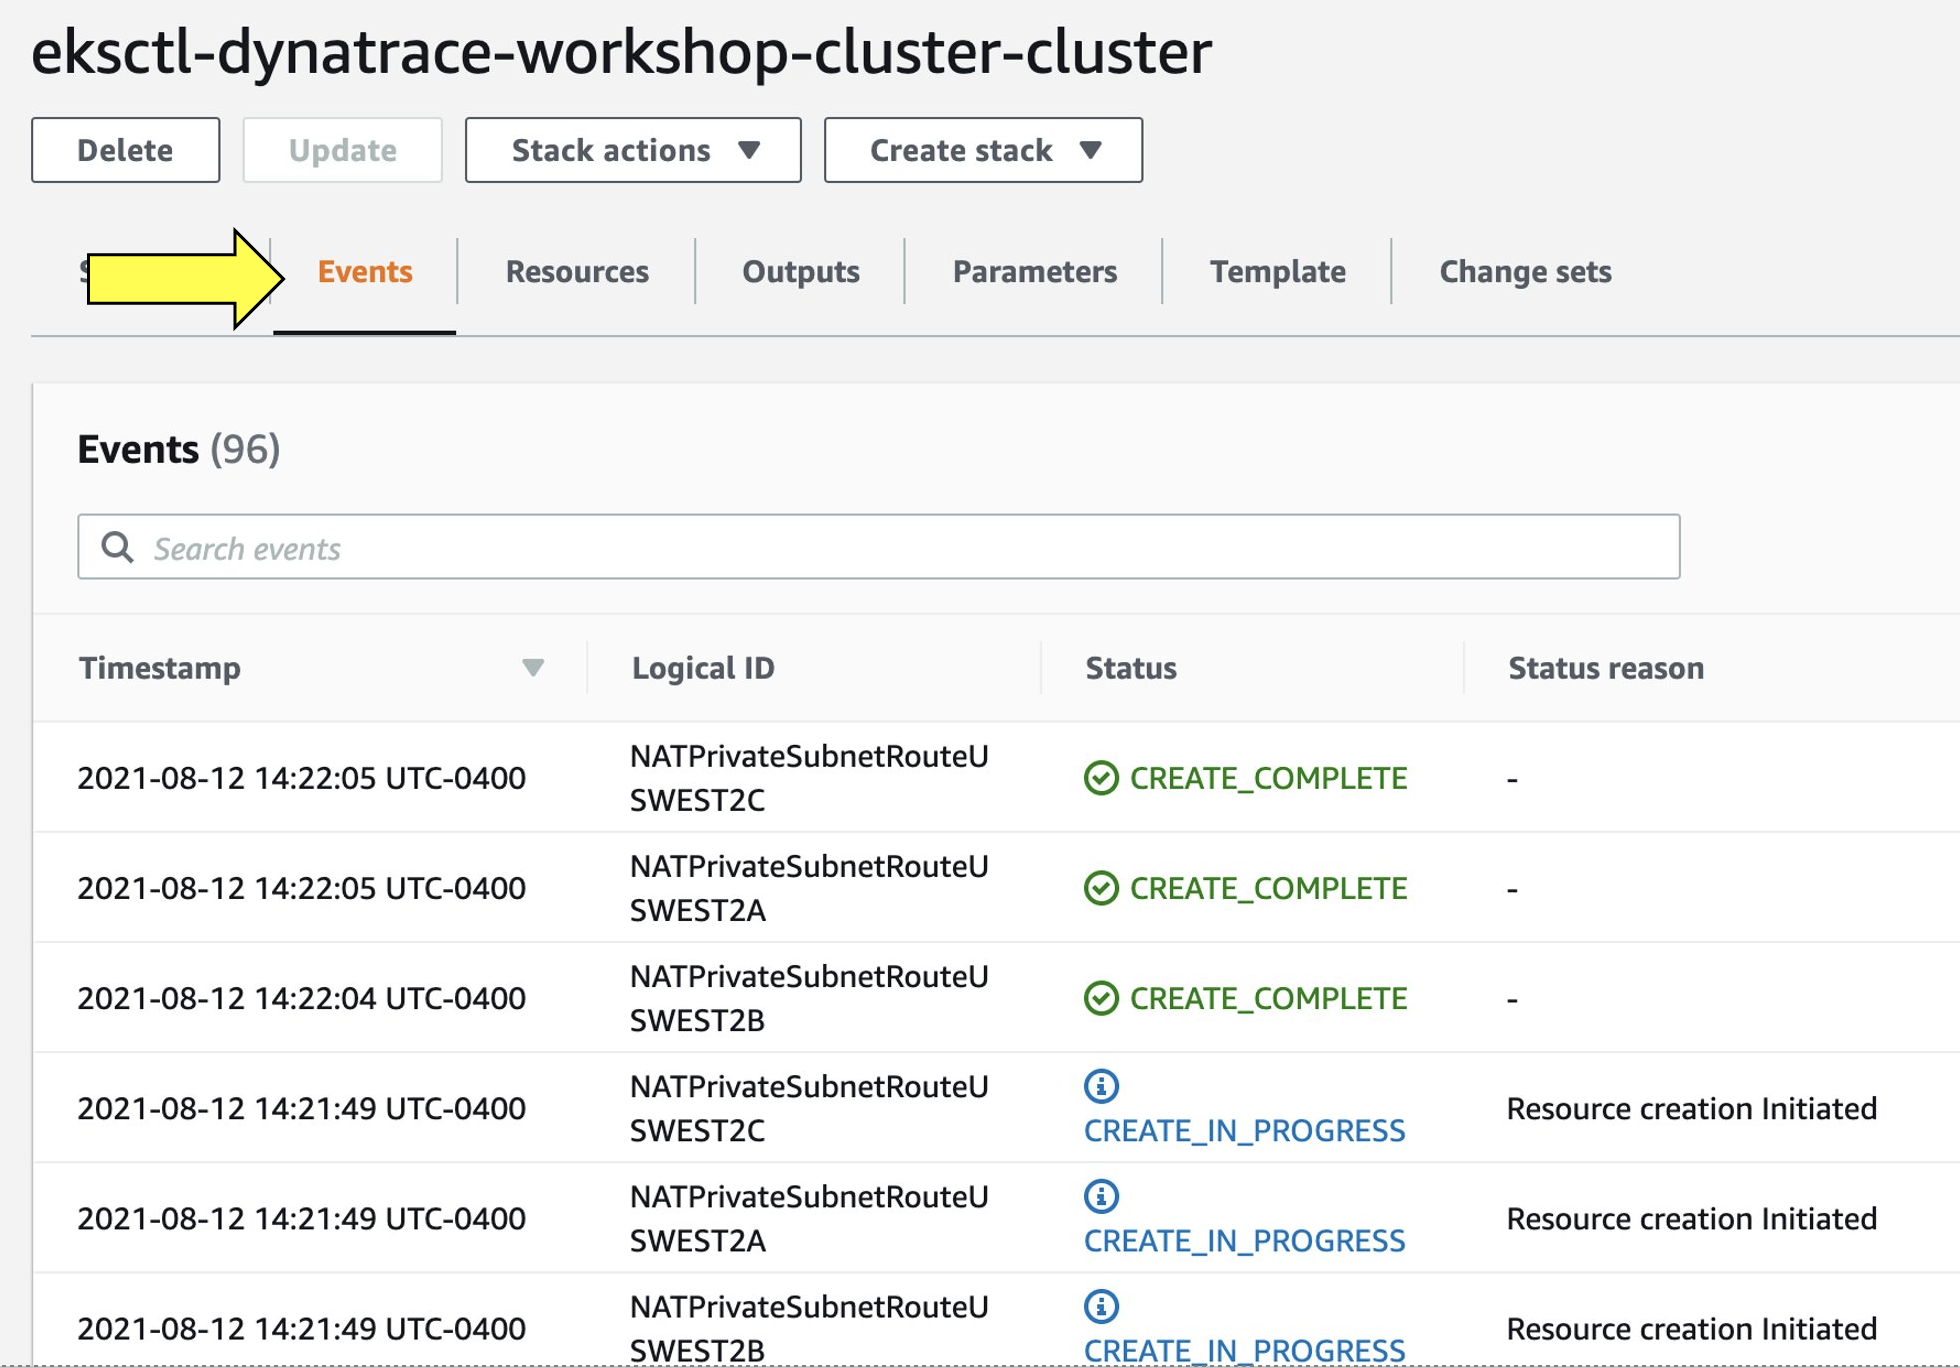
You can monitor this as it runs for about 30 minutes. When it's complete, all statuses will show CREATE_COMPLETE
Only proceed with this next step once the CloudFormation stack shows CREATE_COMPLETE status.
1. Verify Cluster within AWS Console
With the AWS Console, search for the Elastic Kubernetes Service or click on the link below.
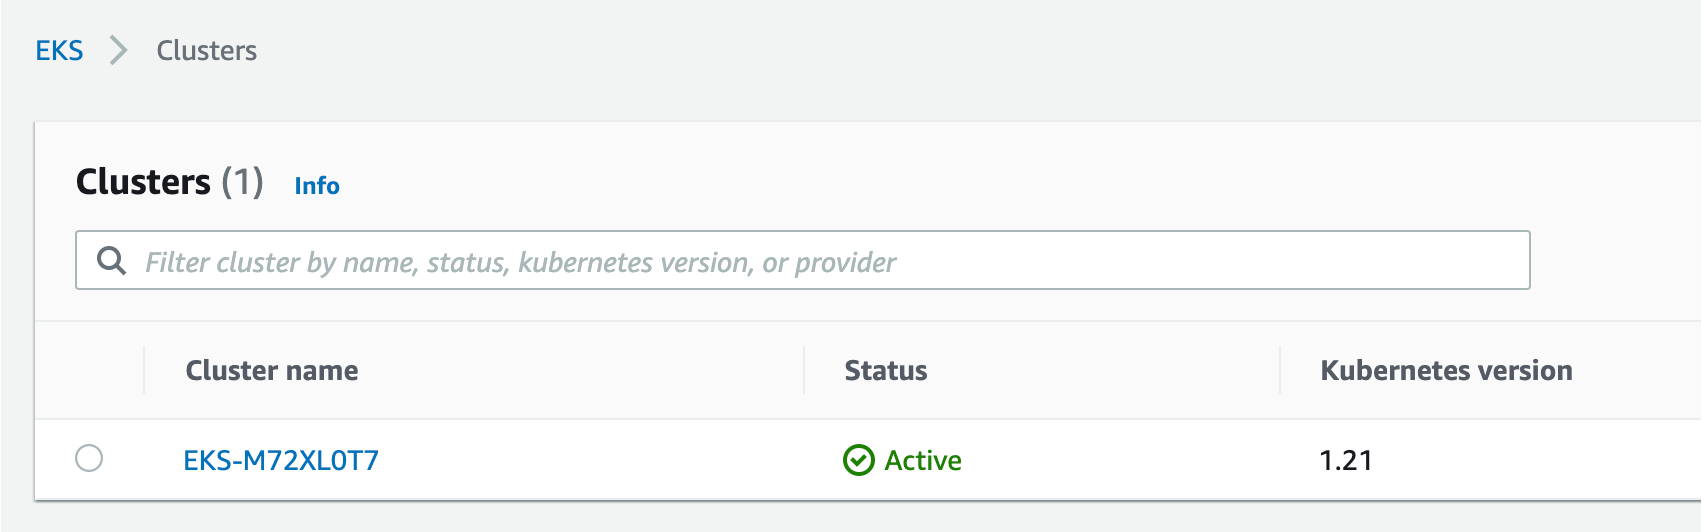
The cluster page, click on the new workshop cluster. Next click on the resources tab –> in the left hand menu under the Clusters section click on Nodes. You should see a few nodes listed as shown below.
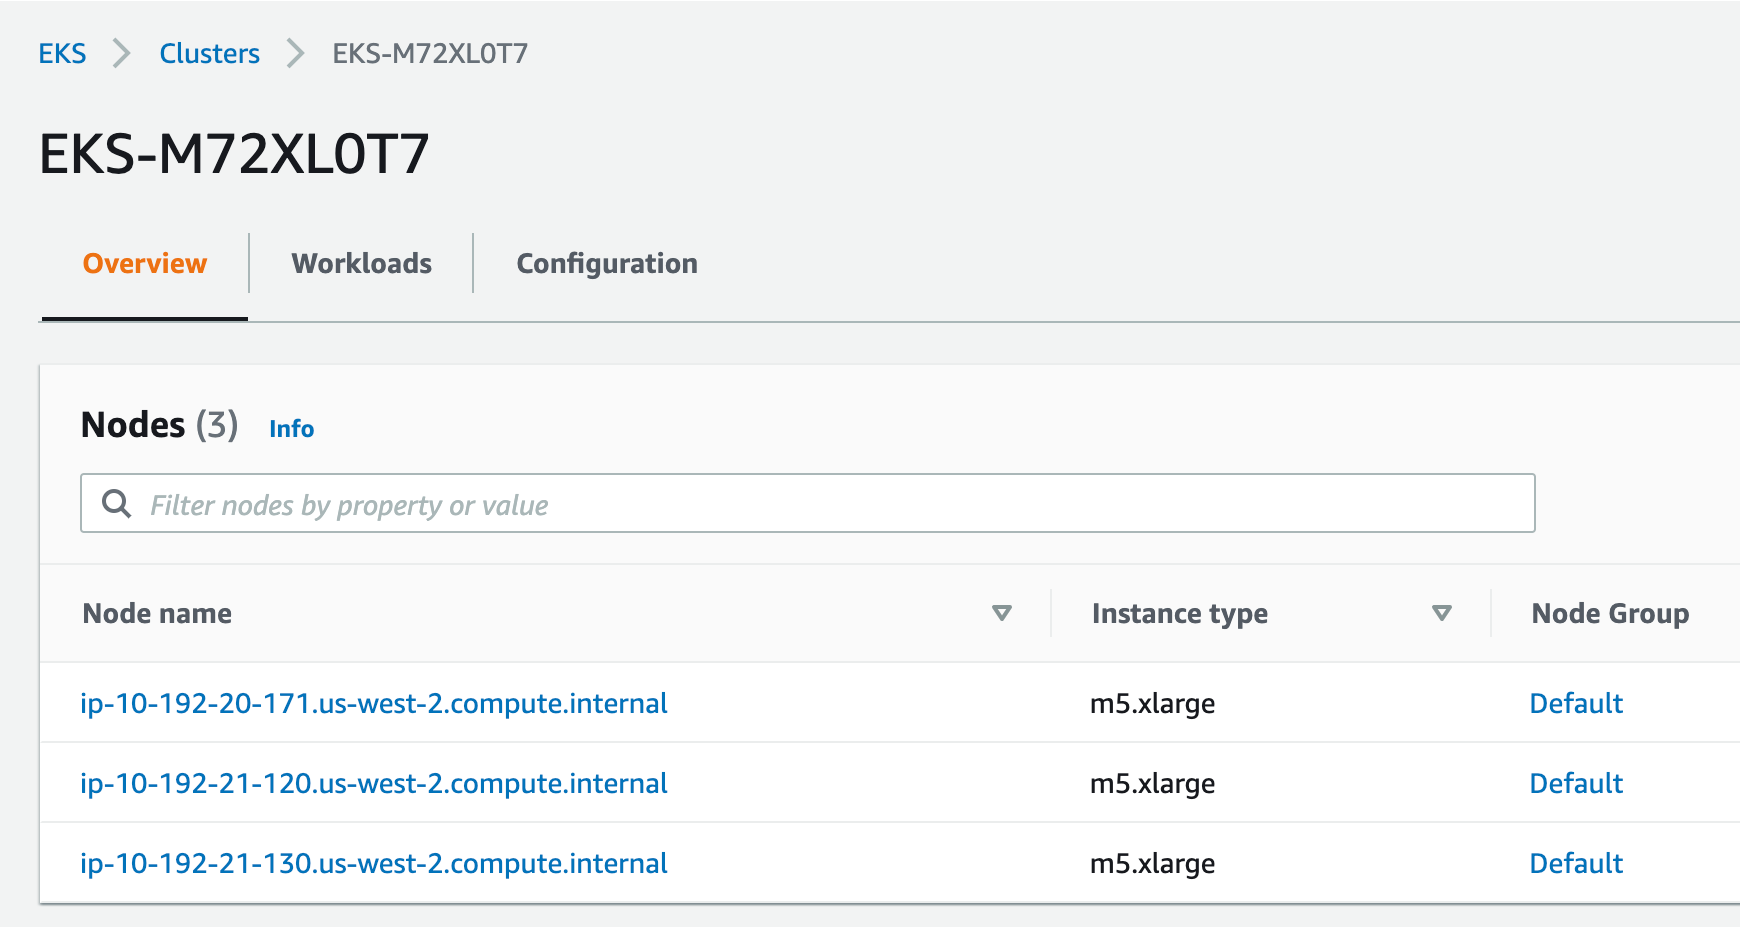
Explore the configuration and view nodes details.
2. Verify Cluster using kubectl
Using the CloudShell, you can verify the new cluster with the kubectl command line tool used to control Kubernetes clusters. content/99_cleanup/index.md
- Run this command to display the command line options
kubectl - Run this command to configure
kubectlto connect to the clusteraws eks update-kubeconfig --name $(aws eks list-clusters | jq -r .clusters[0]) - Verify you are connected. You should see
dynatrace-workshopas part of the output.
The output should look something like this:kubectl config current-context[user-info]@dynatrace-workshop.us-west-2.eksctl.io - List the nodes in the cluster
The output should look like this:kubectl get nodes
You can see even more detail with this command.NAME STATUS ROLES AGE VERSION ip-192-168-31-207.us-west-2.compute.internal Ready <none> 5d23h v1.21.2-eks-c1718fb ip-192-168-86-194.us-west-2.compute.internal Ready <none> 5d23h v1.21.2-eks-c1718fbkubectl describe nodes
One key Dynatrace advantage is ease of activation. OneAgent technology simplifies deployment across large enterprises and relieves engineers of the burden of instrumenting their applications by hand. As Kubernetes adoption continues to grow, it becomes more important than ever to simplify the activation of observability across workloads without sacrificing the deployment automation that Kubernetes provides. Observability should be as cloud-native as Kubernetes itself.
In our workshop, we will install the Dynatrace Operator that streamlines lifecycle management. You can read more about it here in this Dynatrace Blog
Organizations will often customize the Dynatrace Operator installation and you can read more about the options in the Dynatrace Doc but, we are going to use a single command that we can get from the Dynatrace interface to show how easy it is to get started.
- To navigate to Deploy Dynatrace Page, follow these steps and refer to the picture below:
- Within Dynatrace, click on the
Deploy Dynatracemenu - Click on the
Start Installationbutton - Click on the
Kubernetesbutton
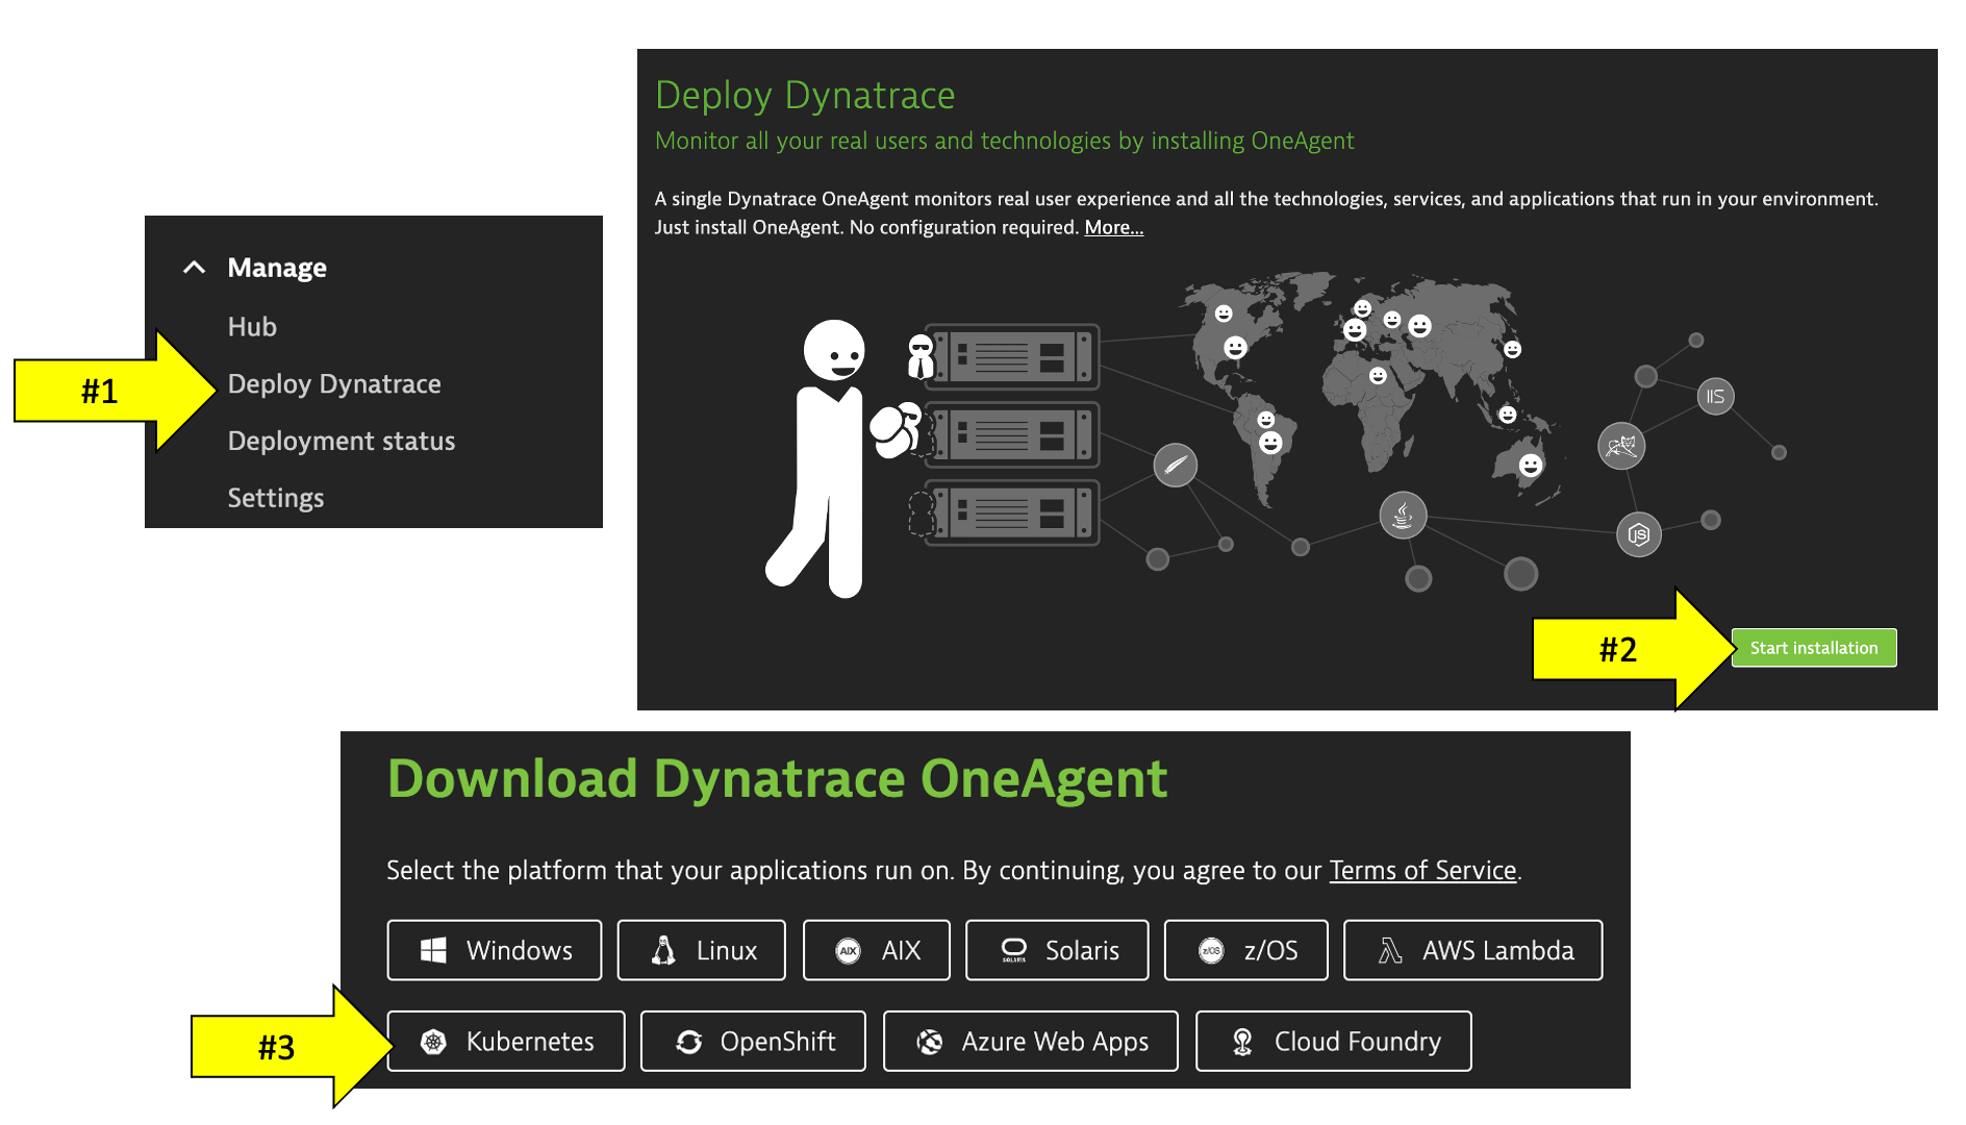
- Within Dynatrace, click on the
- To get the Dynatrace Operator installation command, refer to the steps and pictures below:
- On the Kubernetes configuration page, enter
dynatracefor the name andworkshopfor the group. This is not the cluster name, it will show up as the Kubernetes page name in Dynatrace - Click the
Create tokensbutton - Select the
Skip SSL Certificate Checkto be ON
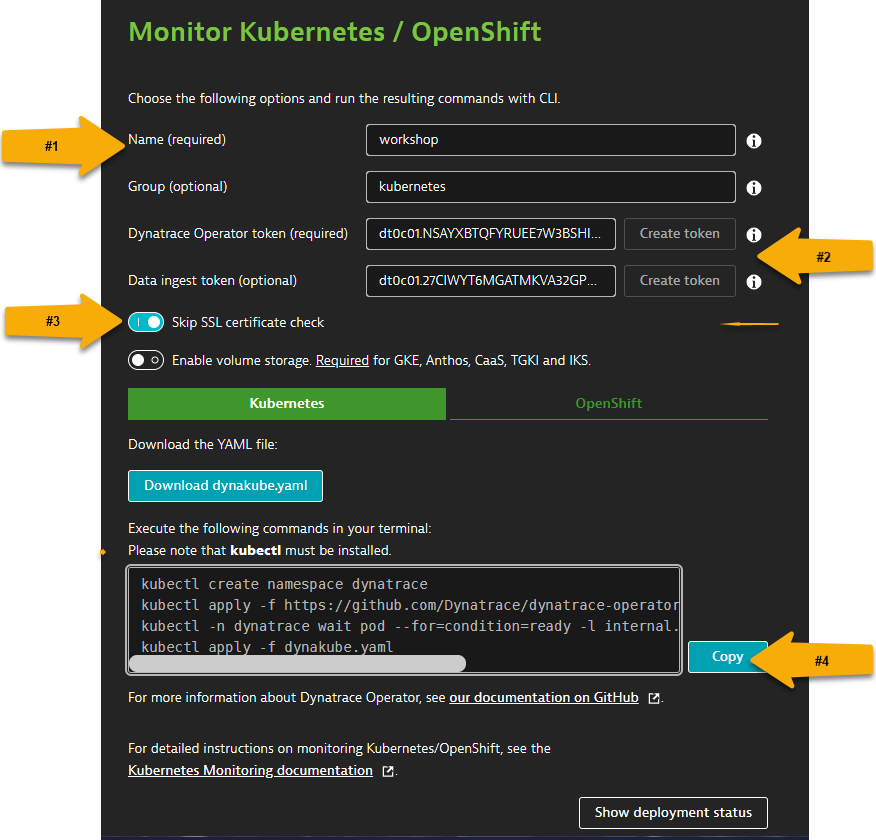
- On the Kubernetes configuration page, enter
- First, copy and paste command below into your AWS Cloud Shell to orient you in correct directory for
dynakube.yamlfile.``` cd ~/aws-modernization-dt-orders-setup/gen ``` - Next, copy the commands from the
Monitor Kubernetes / Openshiftconfiguration page of Dynatrace UI or from below to continue with the Kuberentes Operator Install steps.``` kubectl create namespace dynatrace kubectl apply -f https://github.com/Dynatrace/dynatrace-operator/releases/download/v0.14.1/kubernetes.yaml kubectl -n dynatrace wait pod --for=condition=ready --selector=app.kubernetes.io/name=dynatrace-operator,app.kubernetes.io/component=webhook --timeout=300s kubectl apply -f dynakube.yaml ``` - When you run the command, it will do the following:
- Create a namespace called
dynatracein your cluster containing the Dynatrace Operator supporting pods - Set the OneAgent on each of the cluster nodes as to provide full-stack Dynatrace monitoring
- Create a Kubernetes dashboard that will be populated with the Kubernetes data pulled from the API
- Setup a Dynatrace Active gate that runs as a container in the
dynatracenamespace that is used in the polling of Kubernetes API - Enable preset out-of-the-box Kubernetes dashboards
- Create a namespace called
Once the script is complete, then monitor the installation until you all pods are in Running state with all pods as 1/1.
kubectl -n dynatrace get pods
Rerun the command until the output looks like this:
NAME                                 READY   STATUS    RESTARTS   AGE
dynakube-classic-g5n9d               1/1     Running   0          2m45s
dynakube-classic-vr5qh               1/1     Running   0          2m45s
dynakube-kubemon-0                   1/1     Running   0          2m43s
dynakube-routing-0                   1/1     Running   0          2m45s
dynatrace-operator-f946fb4c6-q5k5g   1/1     Running   0          3m59s
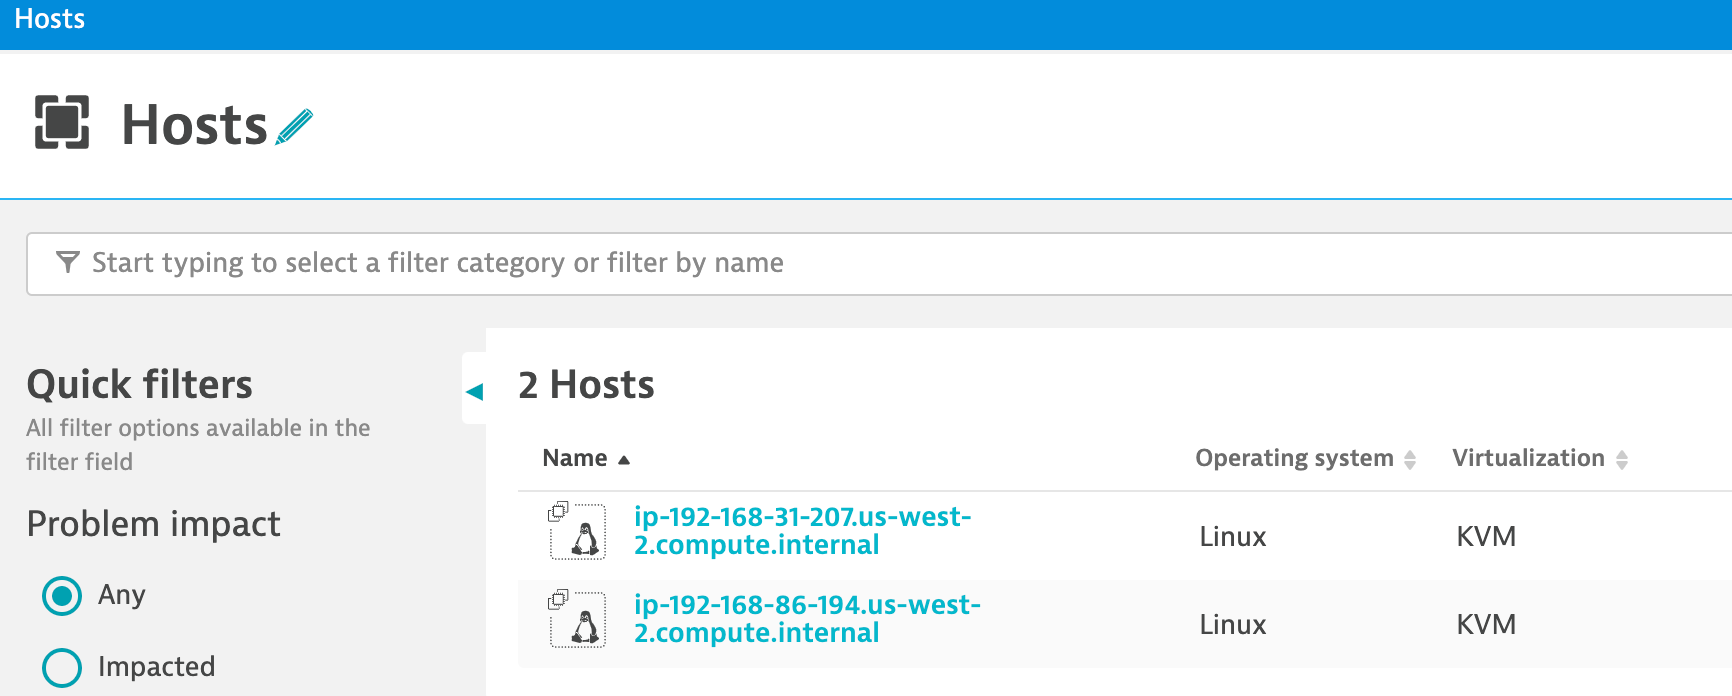
We will review more detail shortly, but quickly verify within Dynatrace that the hosts are now monitored.
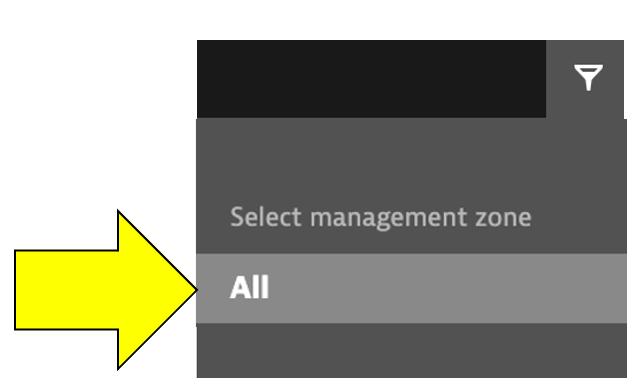
From the left-side menu in Dynatrace choose Hosts. Ensure the management zone filter is set to all ALL
You should see the two hosts like the ones shown below in addition to the host with the name dt-orders-monolith.