Dynatrace automatically derives tags from your Kubernetes/OpenShift labels. This enables you to automatically organize and filter all your monitored Kubernetes/OpenShift application components.
To review what is configured for the sample application, go ahead and open this folder and look at one such as the frontend.yml:
Notice the labels and annotations:
metadata:
      labels:
        app.kubernetes.io/name: frontend
        app.kubernetes.io/version: "1"
        app.kubernetes.io/component: frontend
        app.kubernetes.io/part-of: dt-orders
        app.kubernetes.io/managed-by: helm
        app.kubernetes.io/created-by: dynatrace-demos
      annotations:
        owner: Team Frontend
        chat-channel: dev-team-frontend
Notice the defined container and version. These containers are stored in Dockerhub.
spec:
    containers:
    - name: frontend
    image: dtdemos/dt-orders-frontend:1
Notice the DT_CUSTOM_PROPS environment variable:
env:
    - name: DT_CUSTOM_PROP
        value: "project=dt-orders service=frontend"
💥 TECHNICAL NOTES
- The
DT_CUSTOM_PROPSis a special Dynatrace feature, that the OneAgent will automatically recognize and make Dynatrace tags for the process. You can read more details in the Dynatrace documentation - Read more details on how Dynatrace identifies labels and tags Kubernetes in the Dynatrace documentation
Back in the SSH shell, run these commands to deploy the application:
cd ~/aws-modernization-dt-orders-setup/app-scripts
./start-k8.sh
💥 TECHNICAL NOTE
The start-k8.sh script automates a number of kubectl commands:
- Create a namespace called
stagingwhere all these resources will reside - Grant the Kubernetes default service account a viewer role into the
stagingnamespace - Create both the
deploymentandserviceKubernetes objects for each of the sample
Verify the pods are starting up
Rerun this command until all the pods are in Running status with all pods as 1/1.
kubectl -n staging get pods
The output should look like this:
NAME                               READY   STATUS    RESTARTS   AGE
browser-traffic-5b9456875d-ks9vw   1/1     Running   0          30h
catalog-7dcf64cc99-hfrpg           1/1     Running   0          2d8h
customer-8464884799-vljdx          1/1     Running   0          2d8h
frontend-7c466b9d69-9ql2g          1/1     Running   0          2d8h
load-traffic-6886649ddf-76pqf      1/1     Running   0          2d8h
order-6d4cd477cb-9bvn4             1/1     Running   0          2d8h
Kubernetes Role Binding - Overview
In Kubernetes, every pod is associated with a service account which is used to authenticate the pod's requests to the Kubernetes API. If not otherwise specified the pod uses the default service account of its namespace.
- Every namespace has its own set of service accounts and thus also its own namespace-scoped default service account. The labels of each pod for which the service account has view permissions will be imported into Dynatrace automatically.
- In order for Dynatrace to read the Kubernetes properties and annotations, you need to grant the Kubernetes default service account a viewer role into the
stagingnamespace to enable this. We only have one namespace, but you will need to repeat these steps for all service accounts and namespaces you want to enable for Dynatrace within your environments.
For the workshop, we already updated the required file with the staging namespace. Next you will run the setup script that will apply it to your cluster. Go ahead and open this folder and look at the dynatrace-oneagent-metadata-viewer.yaml file.
Refer to this picture for a more detailed description of our setup.
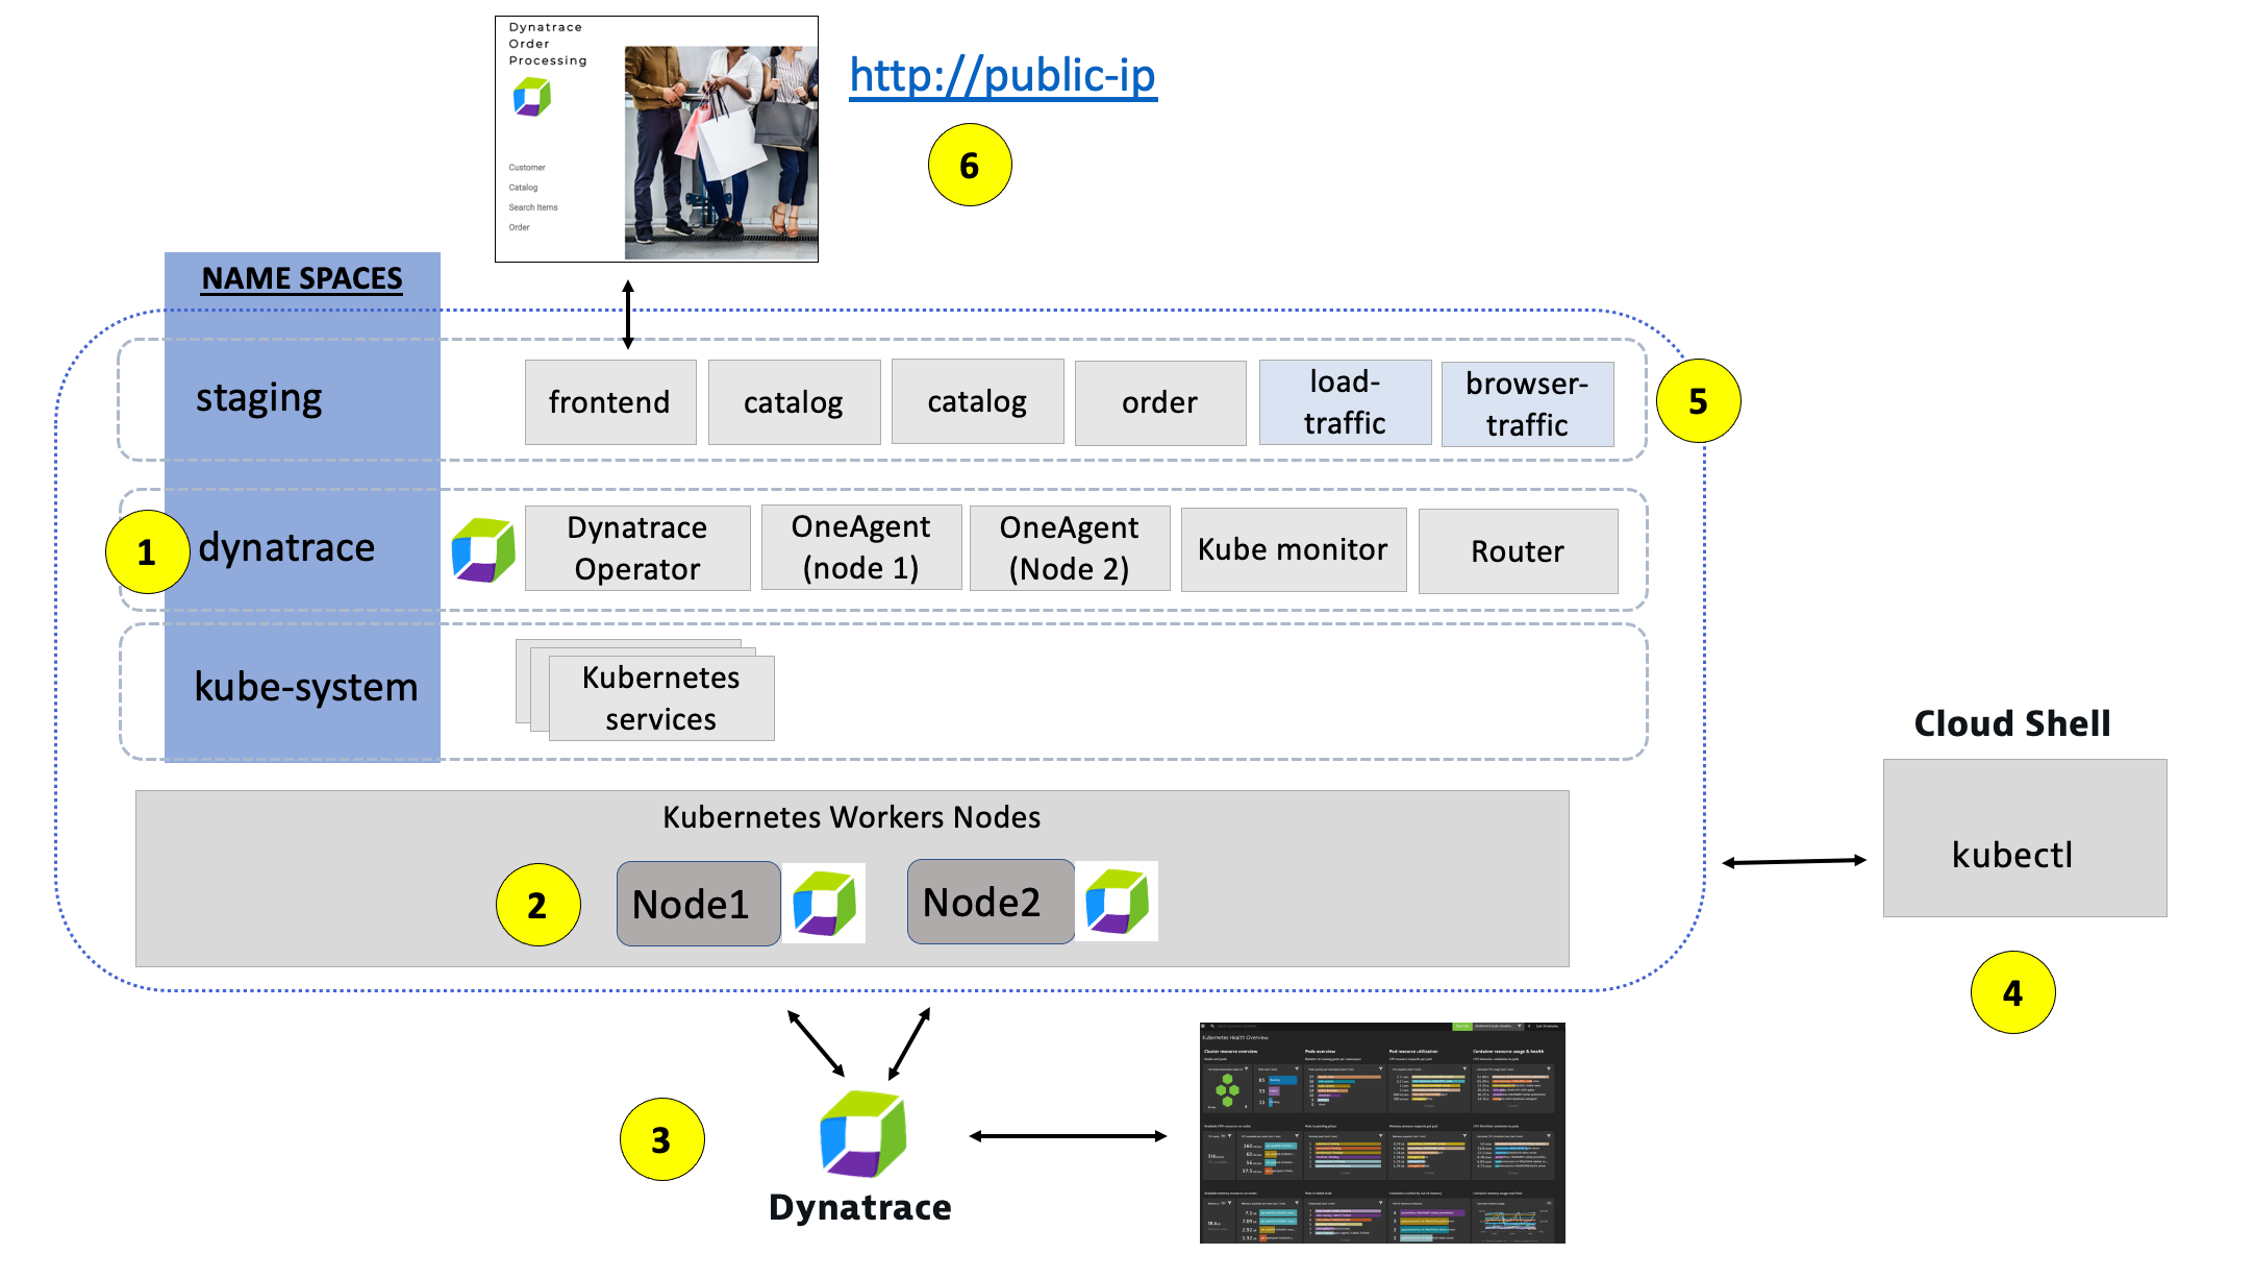
1 - Dynatrace Namespace
This Kubernetes Namespace contains the pods and services that make up the Dynatrace Operator.
2 - Kubernetes nodes
Kubernetes runs your workload by placing containers into Pods to run on Nodes.
3 - Dynatrace
Dynatrace tenant where monitoring data is collected and analyzed.
4 - Cloud shell
The shell is configured with the kubectl command line tool that lets you control Kubernetes clusters.
5 - Sample application namespace
This Kubernetes Namespace contains the sample application pods and services.
6 - Sample application
The frontend service is exposed as a public IP and is accessible in a browser.
To view the application, we need to get the IP to the Kubernetes service for the sample application. To do this, we need to run a kubernetes command.
From the SSH CLI SSH command prompt type this command
kubectl -n staging get svc
Example output
NAME       TYPE           CLUSTER-IP       EXTERNAL-IP
catalog    ClusterIP      10.100.181.171   <none>
customer   ClusterIP      10.100.147.216   <none>
frontend   LoadBalancer   10.100.58.2      a6ebaa4a370e0468093167462c3aeab2-115097342.us-west-2.elb.amazonaws.com
order      ClusterIP      10.100.228.17    <none>
From the output, copy the entire value from EXTERNAL-IP and open it in a browser. This would be http://1a6ebaa4a370e0468093167462c3aeab2-115097342.us-west-2.elb.amazonaws.com for the example above.
Explore Sample app
Use the menu on on the home page to navigate around the application and notice the URL for key functionality. You will see these URLs later as we analyze the application.
- Customer List = customer/list.html
- Customer Detail = customer/5.html
- Catalog List = catalog/list.html
- Catalog Search Form = catalog/searchForm.html
- Order List = order/list.html
- Order Form = order/form.html
💥 TECHNICAL NOTE
The application looks like this monolith, but notice how the home page shows the versions of the three running backend services. You will see these version updated automatically as we deploy new versions of the backend services.
In this step we will walk through the different Dynatrace dashboards that are available out of the box for monitoring Kubernetes.
Tasks to complete this step
- Validate AWS ActivateGate visible in Dynatrace UI
- Go to the Dynatrace UI.
- From the Dynatrace Menu, click
Manage --> Deployment statusto review OneAgent Deployment status - Within the
Deployment statuspage, next click on theActiveGateoption to review the Active Gate. - From Dynatrace menu on the left, go to Manage -> Deployment Status -> ActiveGates, you will notice there is a
dynatrace-workshop-cluster-activegate-0connected to your Dynatrace environment now. This actigate gate routes all the agent traffic from apps that are running on that AKS cluster.
- Go to the Dynatrace UI.
- Review Kubernetes Dashboards are accessible from the left-side menu in Dynatrace choose
Kubernetesand navigate to the Kubernetes cluster page as shown below:
📓Note: Be sure that your management zone is NOT filtered!**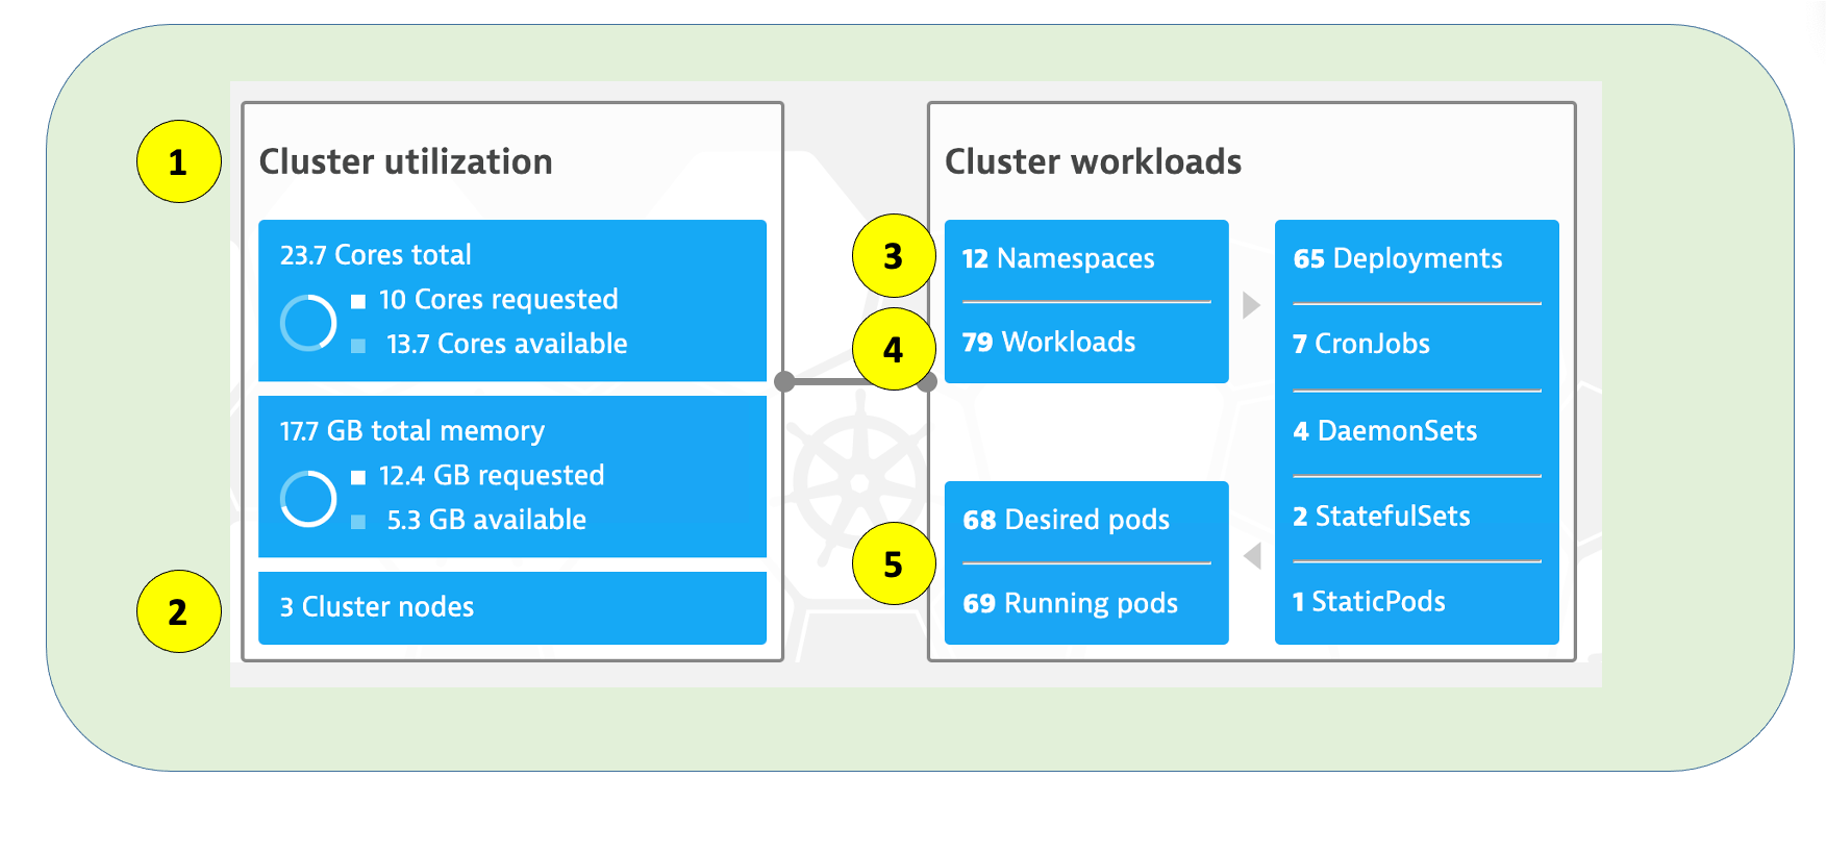 1 - Kubernetes cluster - A summary the Kubernetes cluster is shown at the top of the Kubernetes dashboard.
2 - Nodes - The resources for the Cluster are summarized for the one-to-many hosts or Cluster nodes in this view. Explore specific node in the Node Analysis section, pick the analyze nodes button.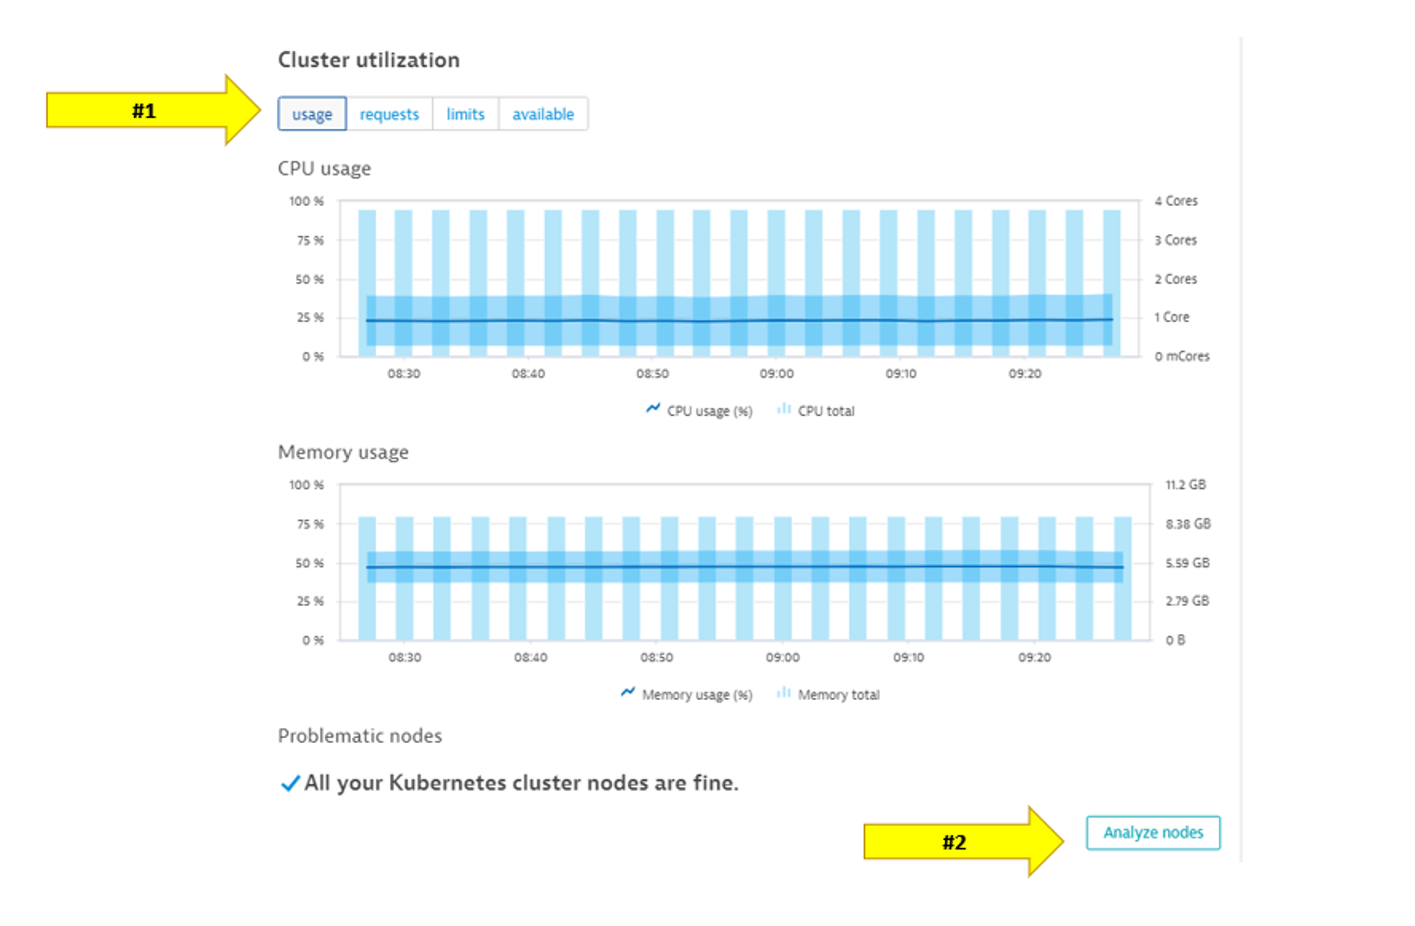 3 - Namespaces - Namespaces are ways to partition your cluster resources to run multiple workloads (for example
 application Aandapplication Bworkloads) on same cluster- This workload section shows workloads over time
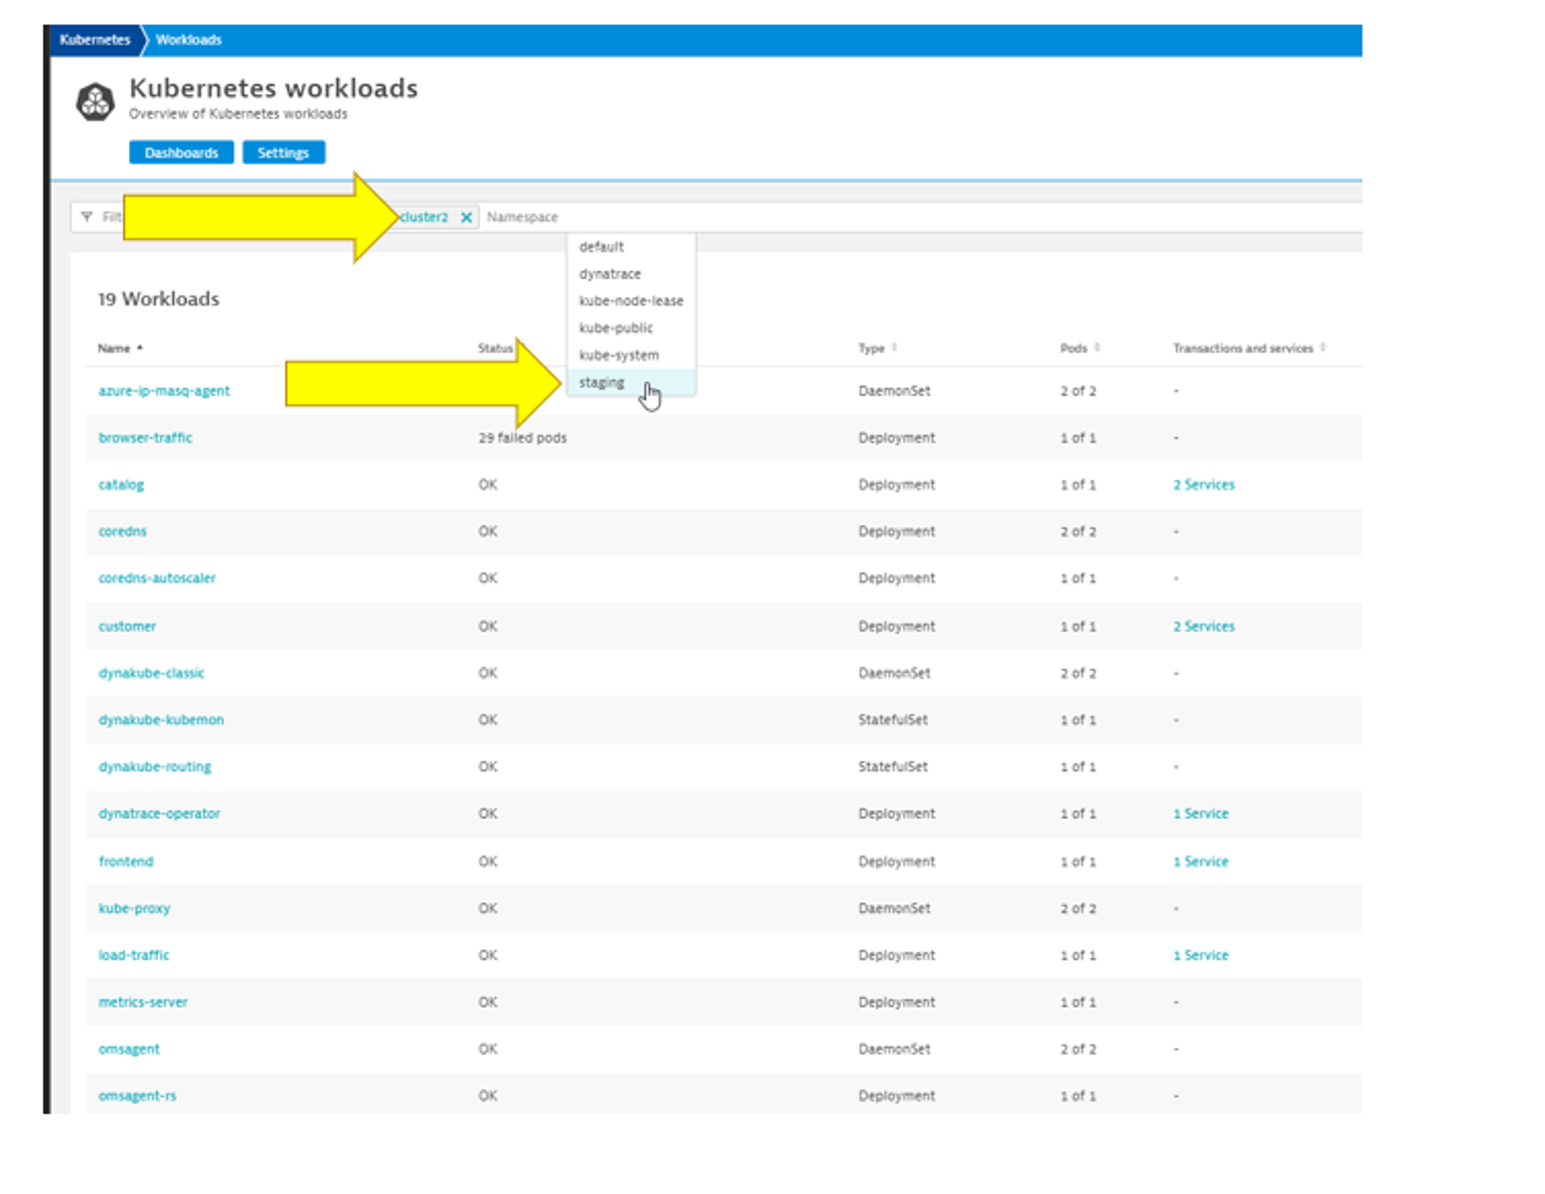
- In the Cluster workload section, pick the view all workloads button.
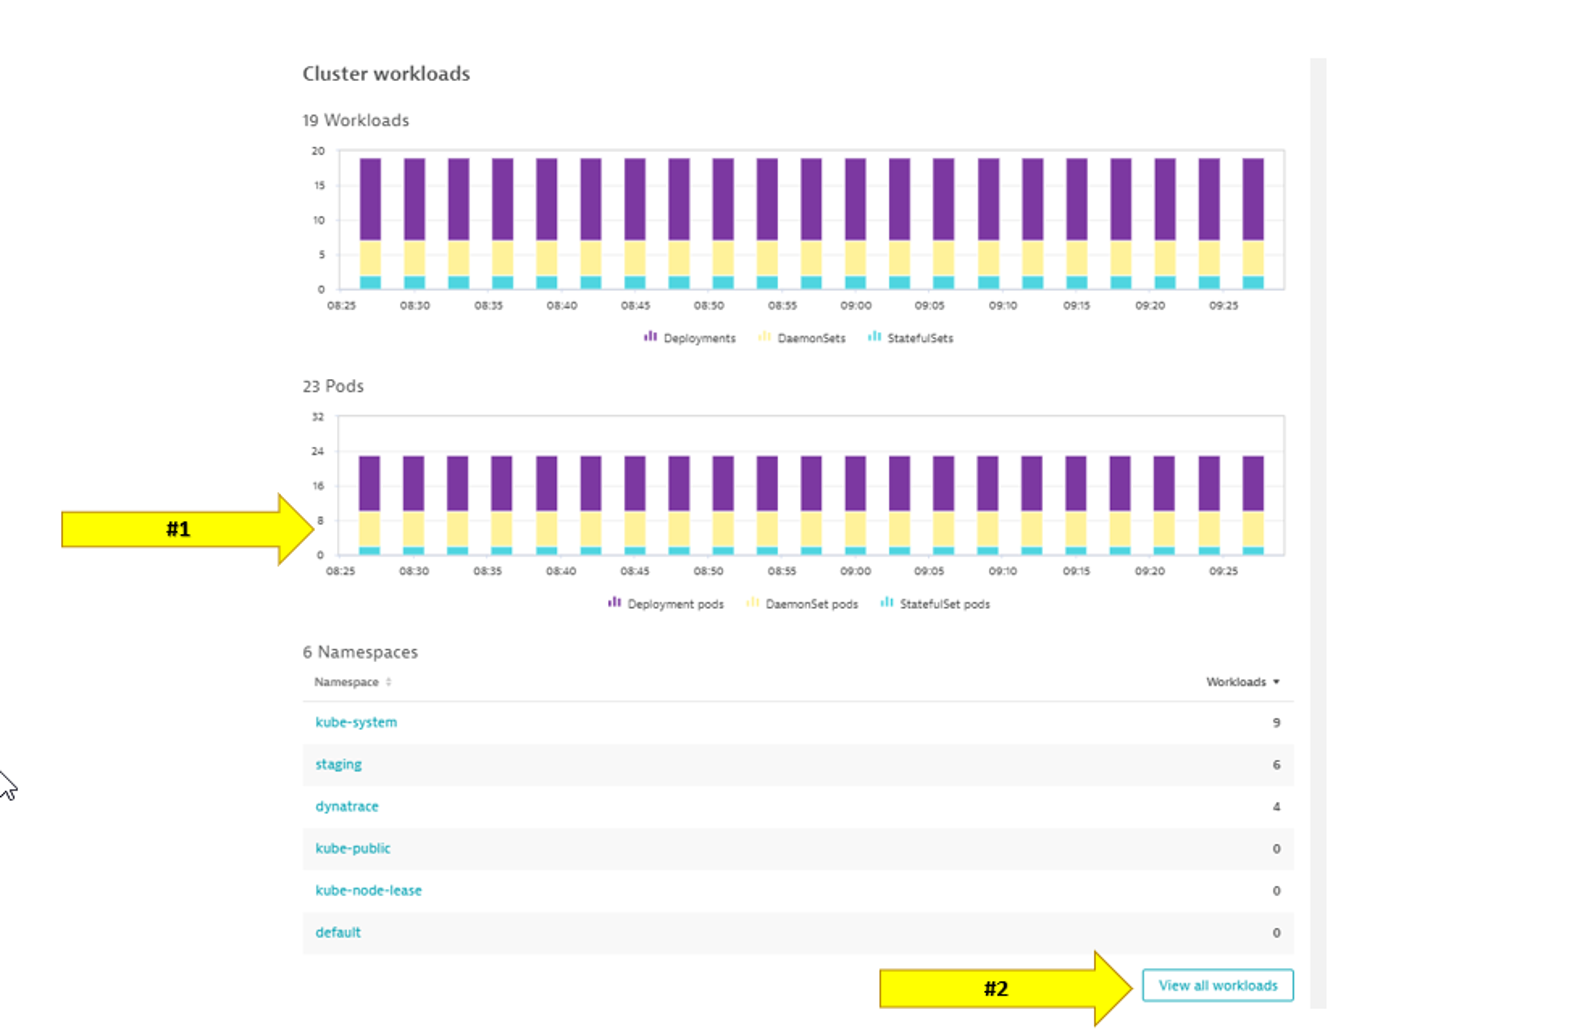
- In the filter, pick namespace then staging
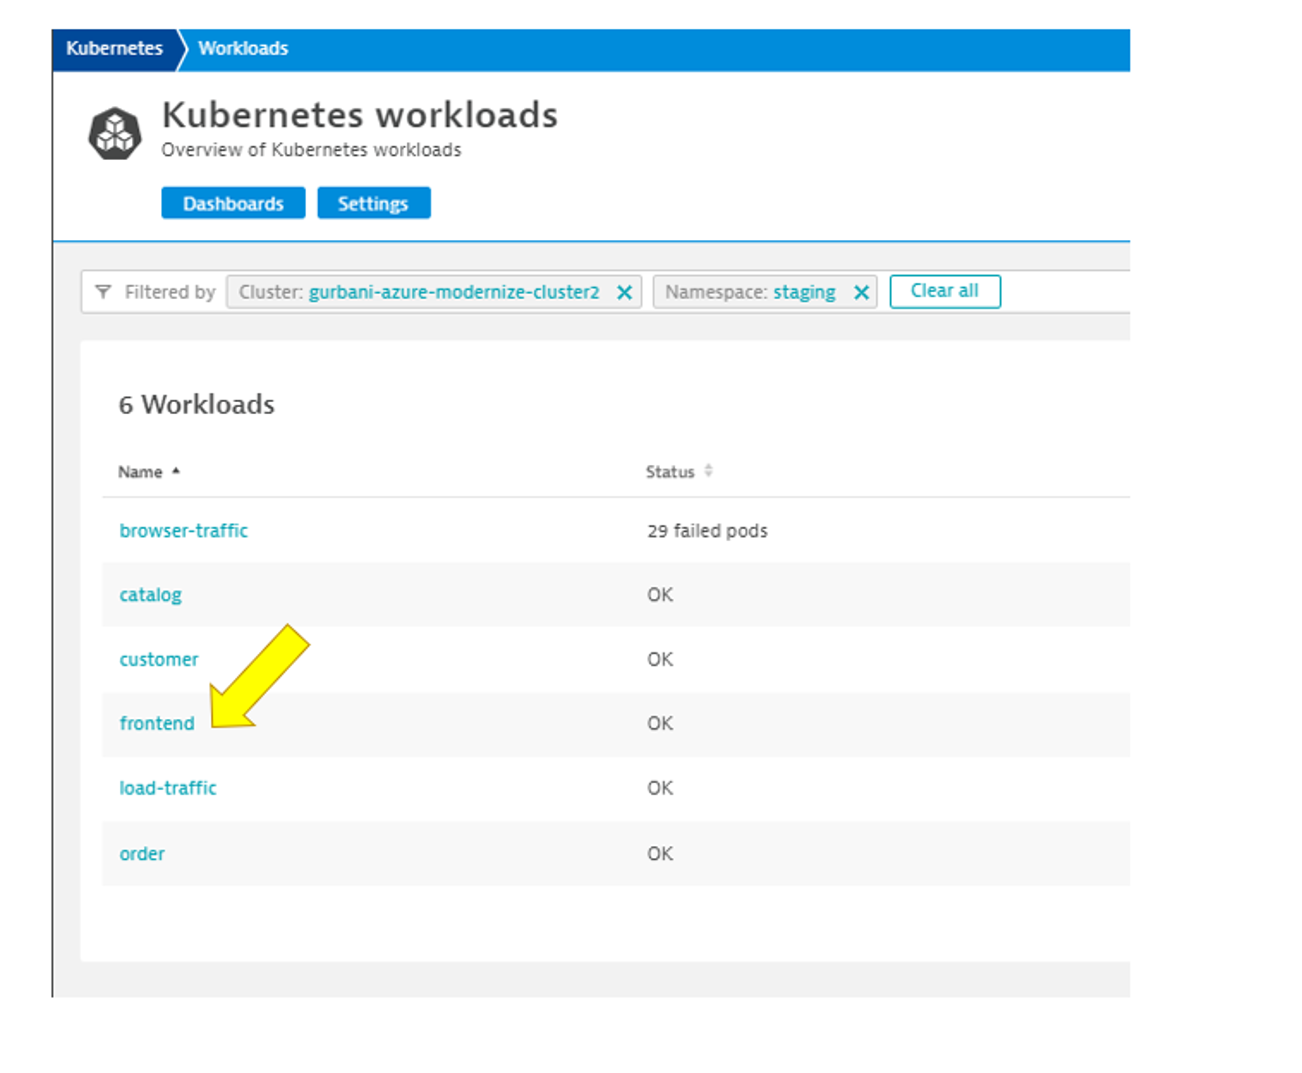
- Pick the frontend to drill into.
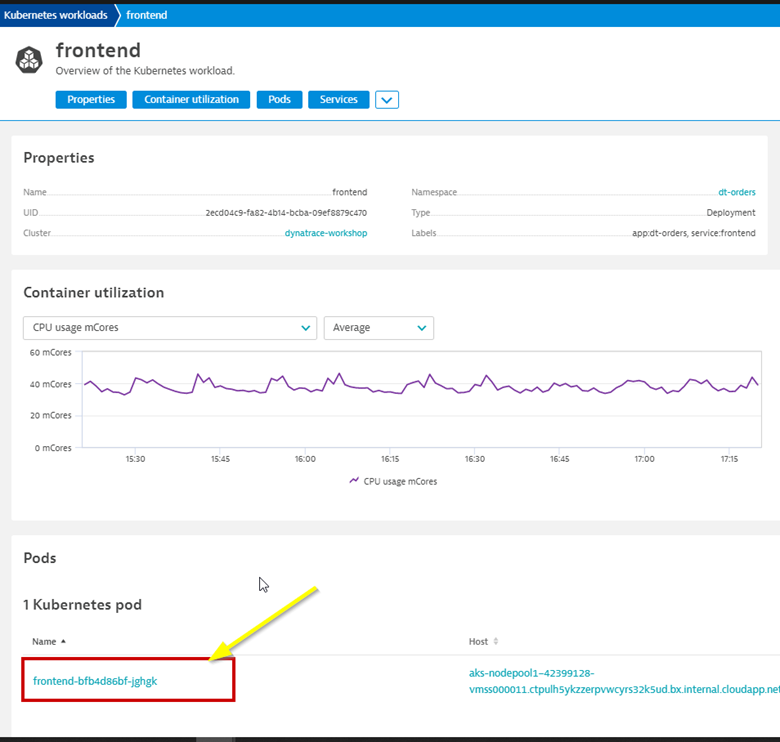
- Review the workload overview page to look at various metrics related to the workload.
- Click on Kubernetes POD to look at POD utilization metrics.
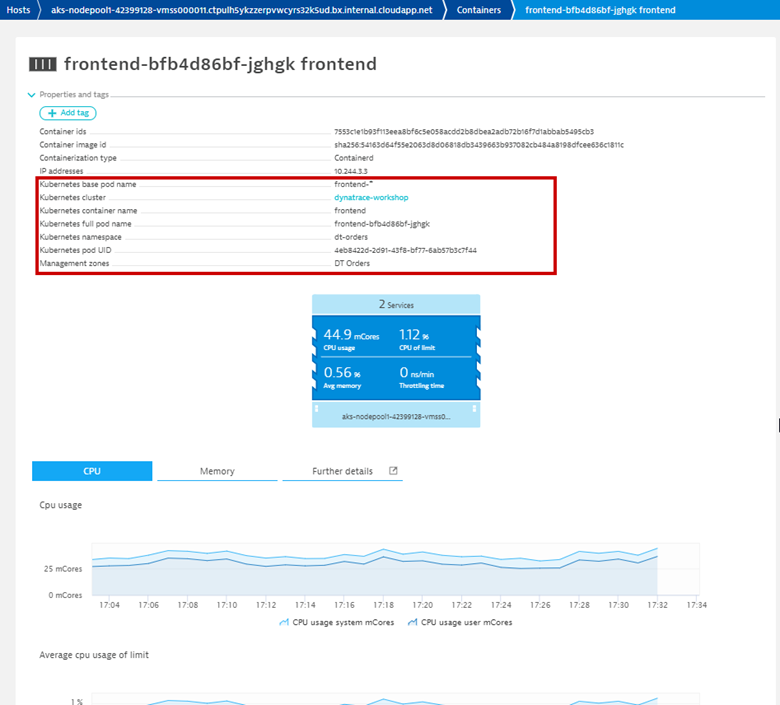
- Click on Container next to look at container metrics
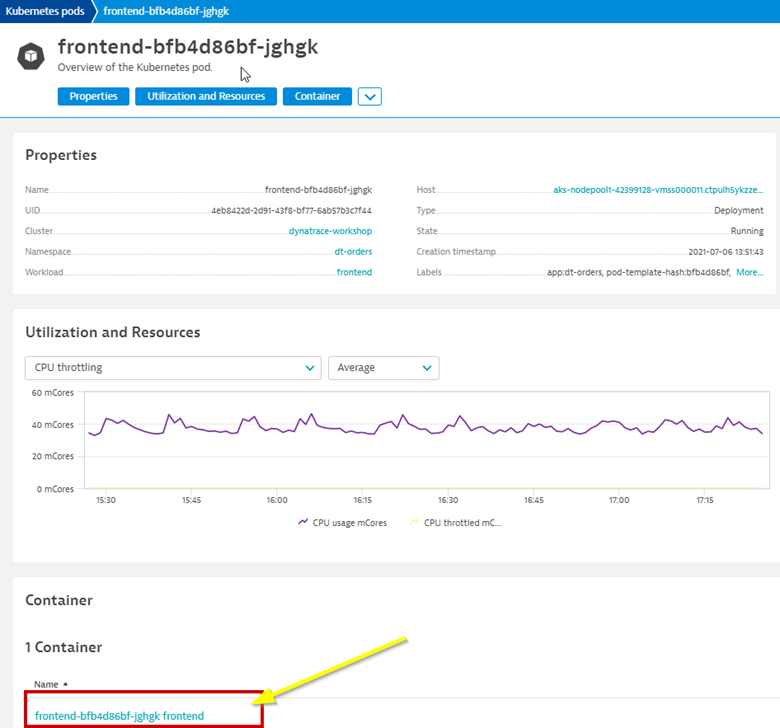
- Container information
- Kubernetes information
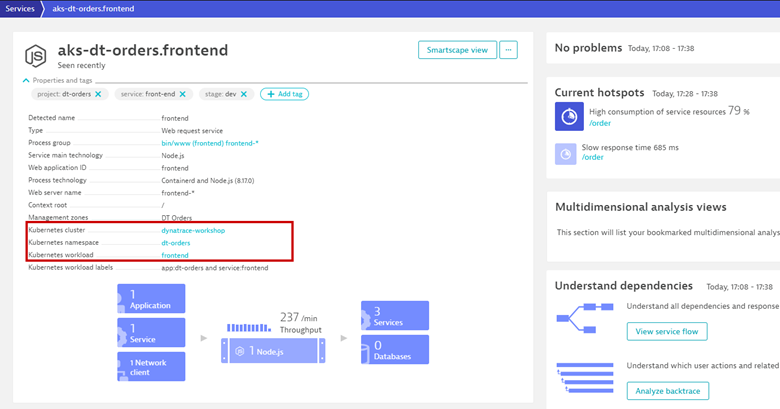
- In the info graphic, pick the service to open the services list
- In the service list, click on k8-frontend service
- Next click on 2 Services Icon to review the services running inside the container
- Select the active front-end service.
Now that we've modernized the application and installed it on Kubernetes, we still need to trace the application transactions from front to back.
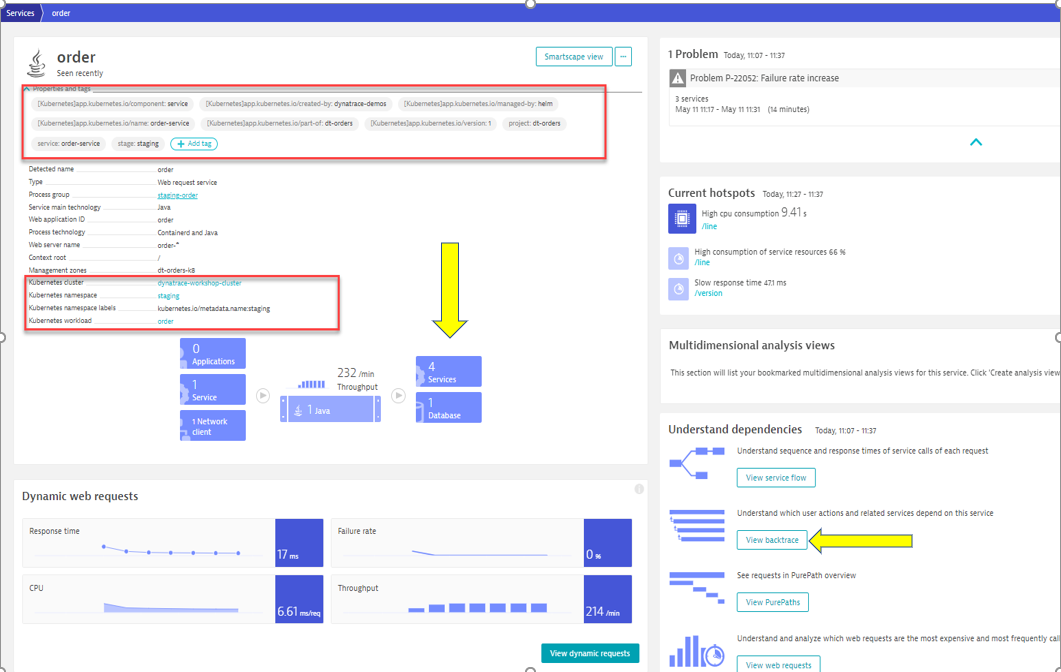
Dynatrace understands your applications transactions from end to end. This transactional insight is visualized several ways like the backtrace.
The backtrace tree view represents the sequence of services that led to this service call, beginning with the page load or user action in the browser.
Dynatrace also gives you insight into what Kubernetes cluster, node, workload, and namespace that service is running on.
Tasks to complete this step
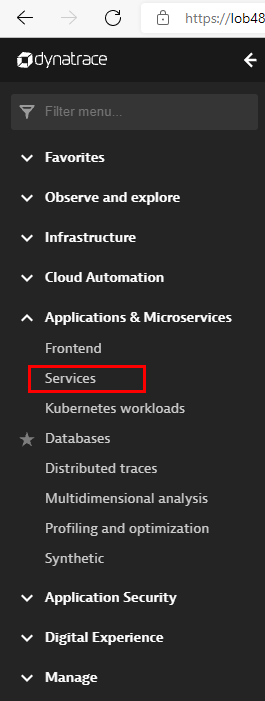
- Review Services View for
orderservice- Left Menu -> Applications & Microservices -> Services
- Top Menu -> filter by
dt-orders-k8 managementzone.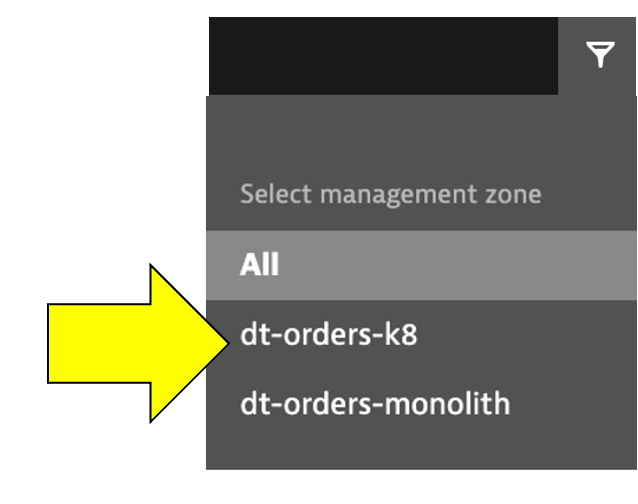
- Pick the
orderservice.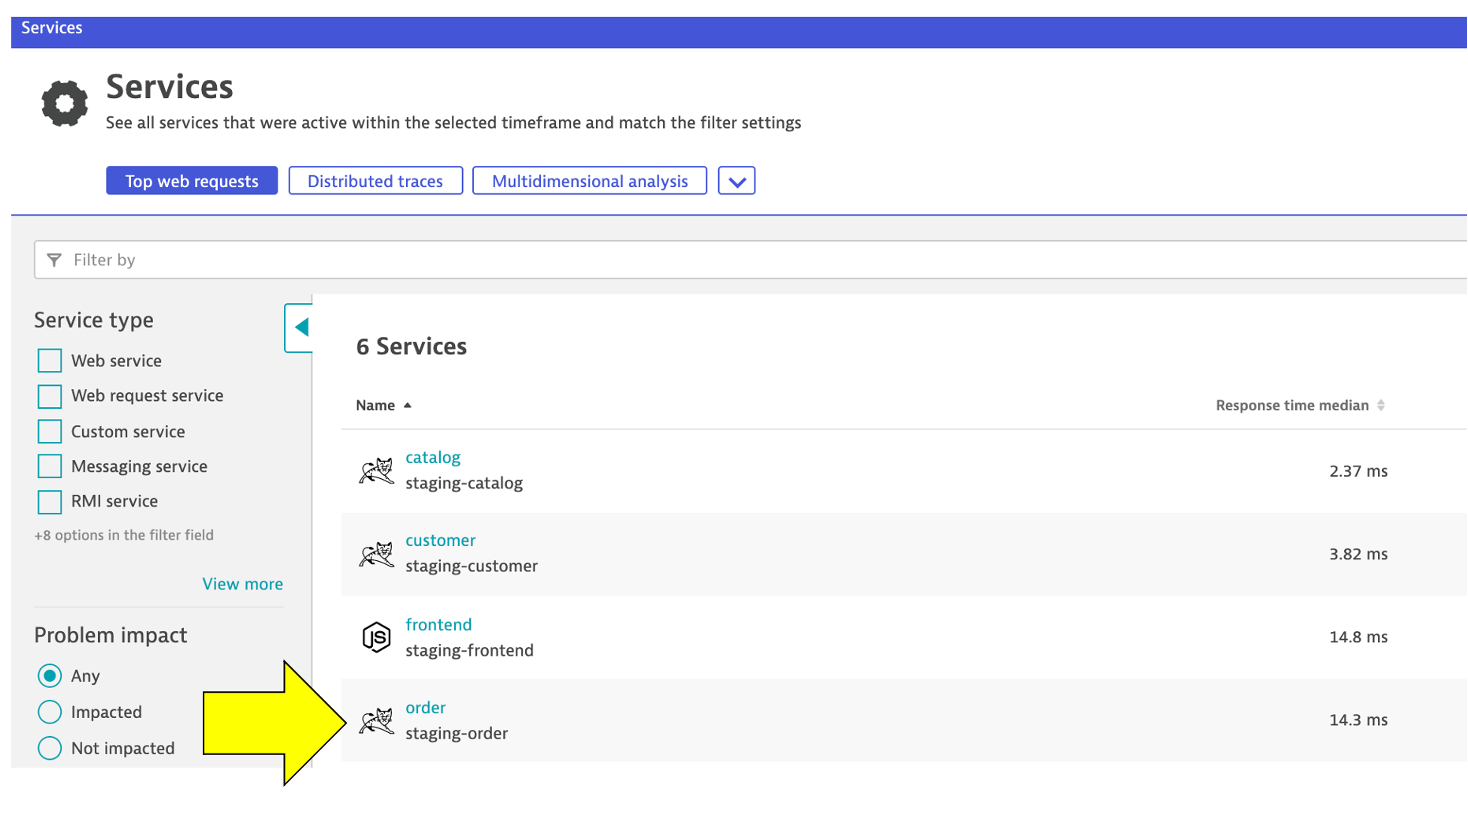
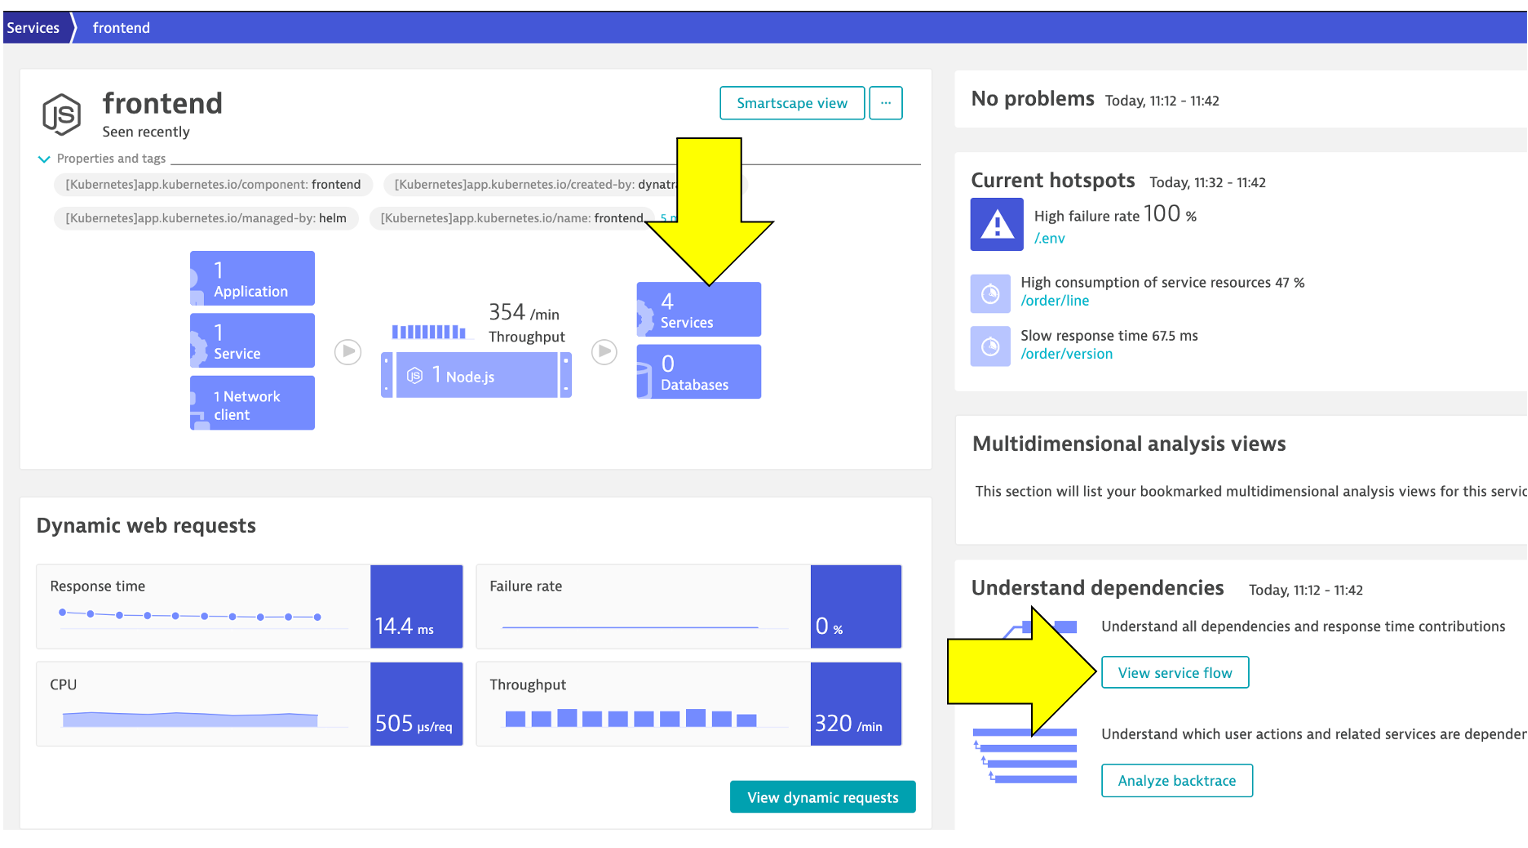
- On this service, we can quickly review the inbound and outbound dependencies.
- Referring to the picture, within the services infographic, click on the "services" square to get a list of the services that the order service calls.
- Left Menu -> Applications & Microservices -> Services
- Review Backtrace View
- To see the backtrace page, just click on the Analyze Backtrace button.
- You should be on the service backtrace page where you will see information for this specific service.
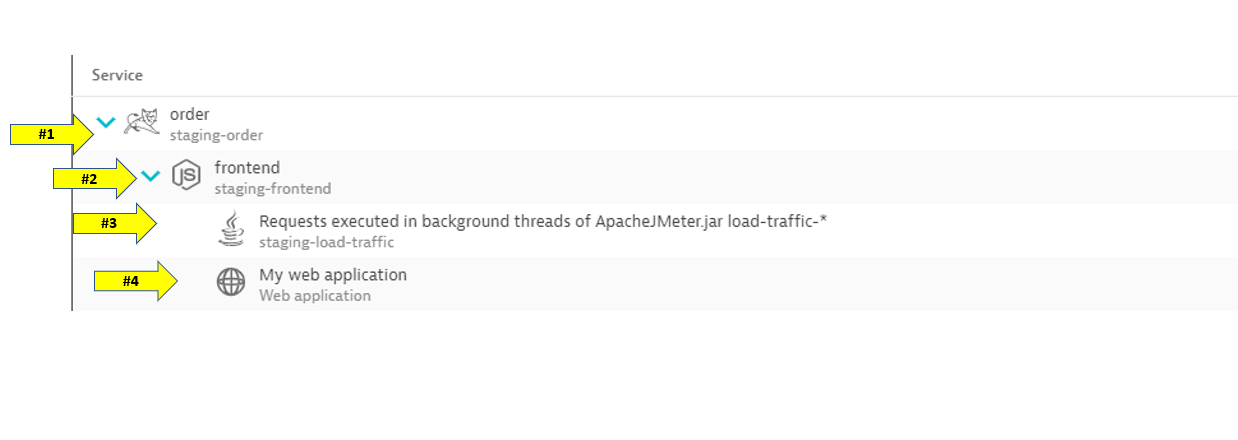
- This will get more interesting in the next lab, but for the monolith backend, we can see that the backtrace is as follows:
- The starting point is the backend
- Backend service is called by the front-end
- Front-end is a where end user requests start and the user sessions get captured
- My web application is the default application that Dynatrace creates
In this step we will walk through the Service Flow view within Dynatrace and see what's different now that its deployed on Kubernetes.
Tasks to complete this step
- Review Services View for
Frontendservice- Left Menu -> Applications & Microservices -> Services
- Top Menu -> filter by
dt-orders-k8 managementzone. - Pick the
frontendservice.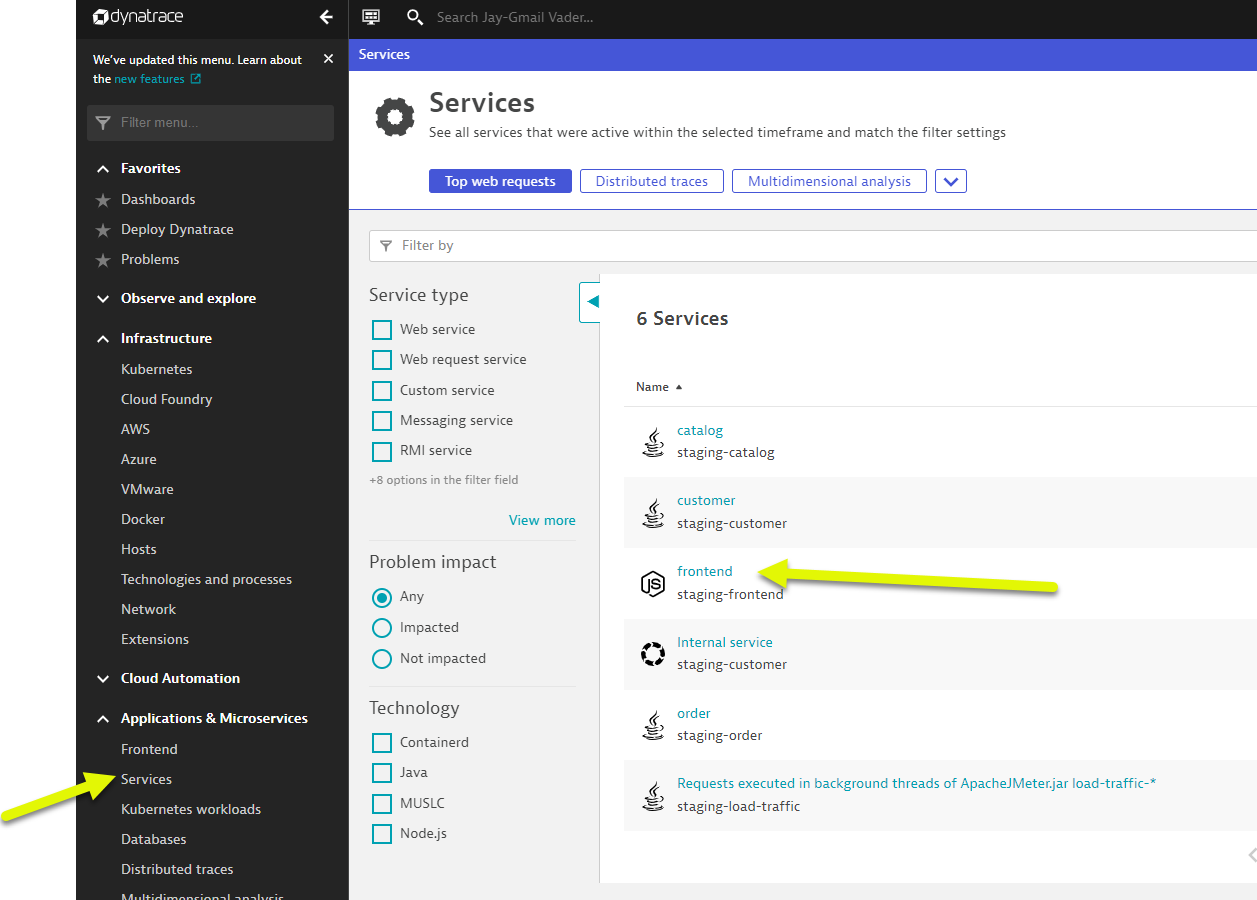
- Just click on the view service flow button to open this.
- Left Menu -> Applications & Microservices -> Services
- Analyze Services view from Response time perspective
- You should now be on the Service flow page.
- Right away, we can see how this application is structured:
- Frontend calls order, customer, and catalog service
- Order service calls order and customer service
- Something you would never know from the application web UI!
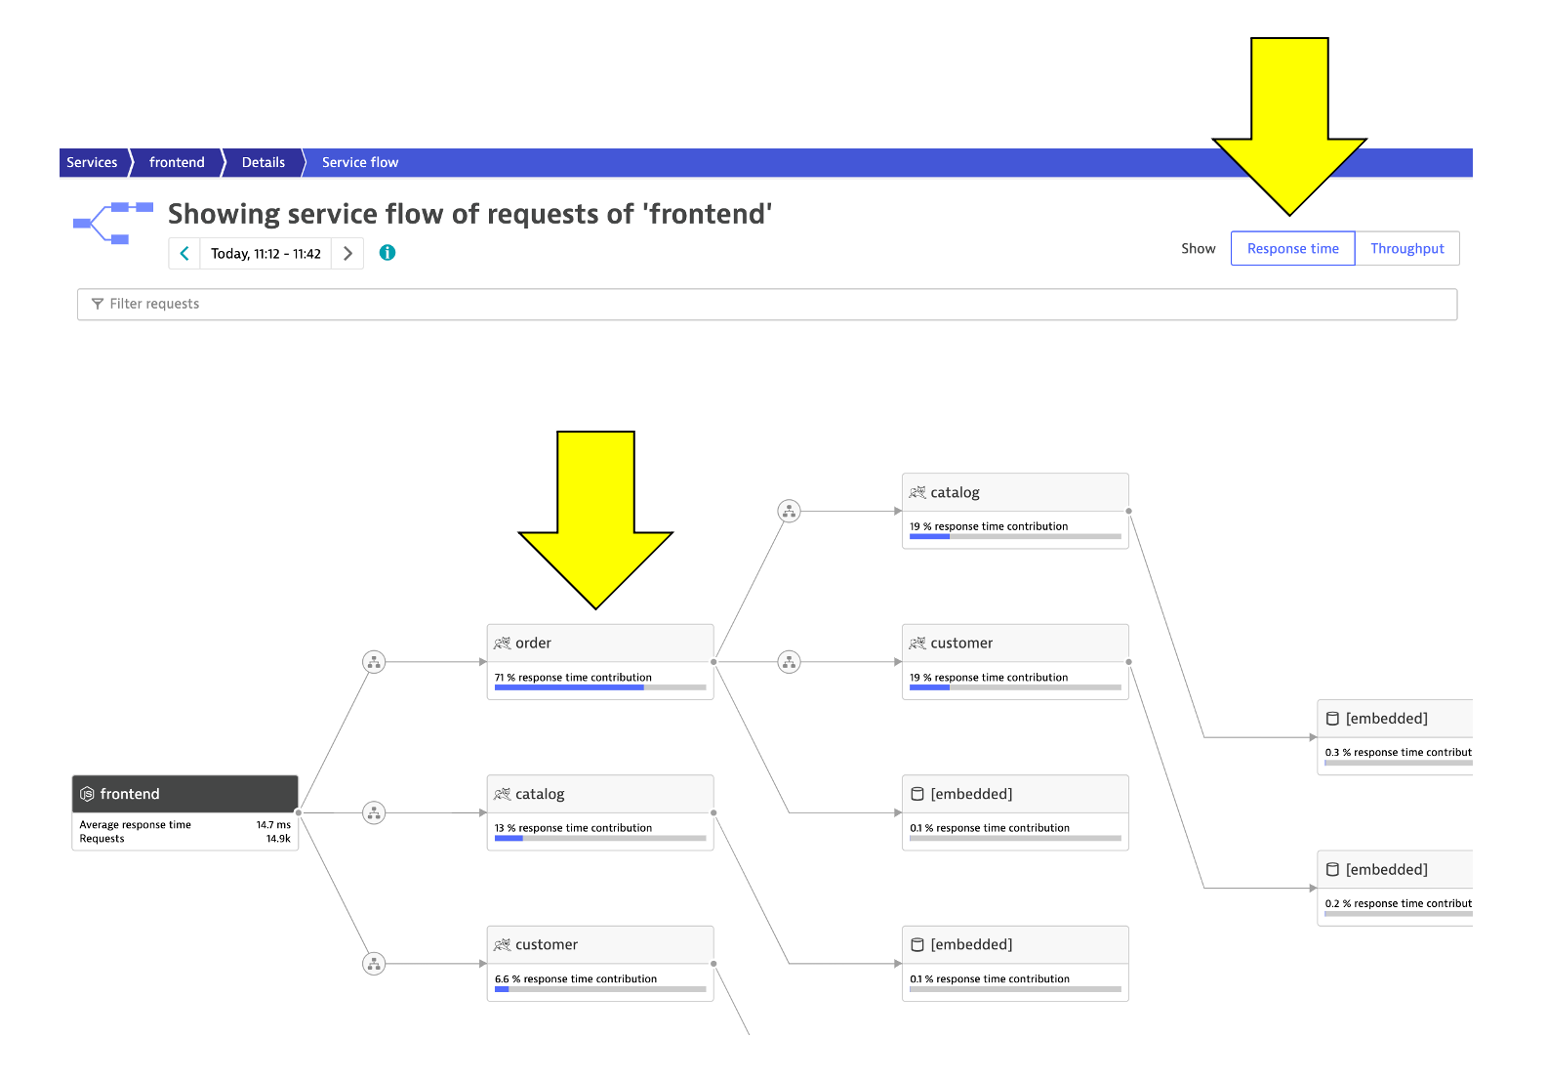
- Refer to the picture above:
- We are viewing the data from a Response time perspective. Shortly, we will review the Throughput perspective.
- Click on the boxes to expand the response time metrics. Most of the response time is spent in the order service and the least in the customer services. And as in the simple version of the application, a very small amount of the response time is spent in the databases.
- Analyze Services view from Throughput perspective
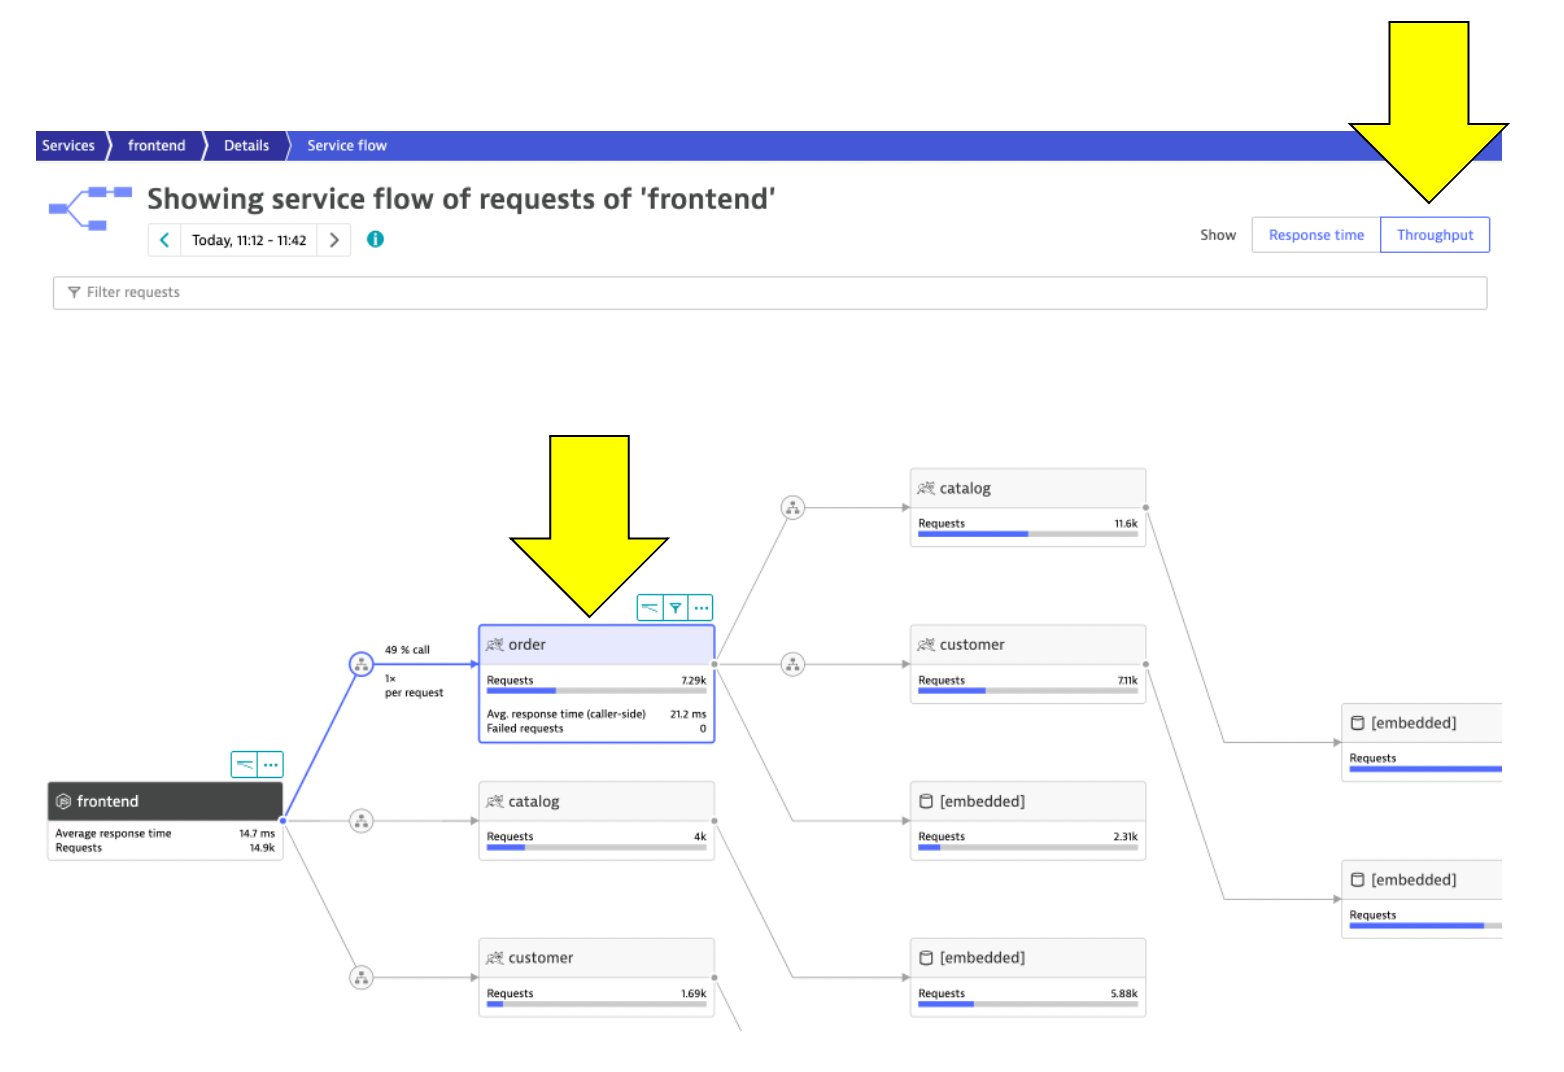
- Refer to the picture above:
- Change to the Throughput perspective by clicking on the box
- Click on the boxes to expand the metrics to see the number of requests and average response times going to each service
- Refer to the picture above:
While migrating to the cloud, you want to evaluate if your migration goes according to the plan, whether the services are still performing well or even better than before, and whether your new architecture is as efficient as the blueprint suggested. Dynatrace helps you validate all these steps automatically, which helps speed up the migration and validation process.
Having the ability to understand service flows enables us to make smarter re-architecture and re-platforming decisions. With support for new technologies like Kubernetes, you have confidence to modernize with a platform that spans the old and the new.
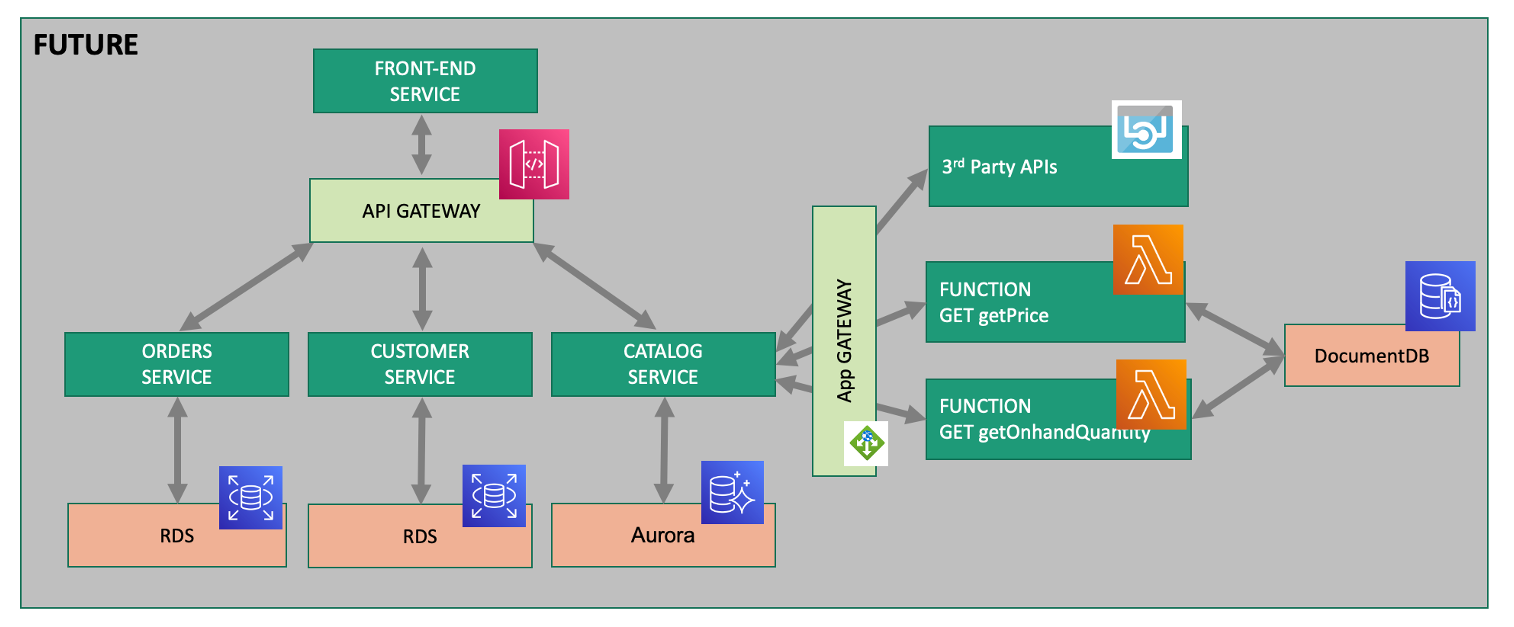
Over time, you can imagine that this sample application will be further changed to add in other technologies like AWS Lambda and other PaaS services like AWS Relational Database Service (RDS) or Amazon Aurora - MySQL and PostgreSQL-compatible relational database databases and virtual networking Amazon API Gateway as shown in the picture below.
💥 TECHNICAL NOTE
We will not cover this, but organizations are establishing DevOps approaches and establishing Continuous Integration (CI) pipelines to build and test each service independently. Then adding Continuous Deployment (CD) to the process too that vastly increase our ability to delivery features faster to our customers. Dynatrace has a number of solutions to support DevOps that you can read about here
💥 TECHNICAL NOTE
Dynatrace sees a lot of demand for Lambda serverless compute service and a slew of new capabilities that you can read about in these Dynatrace blogs
Checklist
In this section, you should have completed the following:
✅ Install the Dynatrace Operator and sample application
✅ Review how the sample application went from a simple architecture to multiple services
✅ We examined the transformed application using service flows and backtraces