Often the monitoring tools organizations use simply don't work in the complex ecosystem of microservices and for technologies like Kubernetes.
Finding the root cause of problems is harder than ever before and the effort required goes beyond what is humanly possible when the application spans to the cloud providers and data centers and the explosion of interconnected services. There are more possibilities for failures and more hiding spots for problems to sneak into the environment when software driving more than just the application.
In this lab, we will trigger a few problem and see how troubleshooting time is significantly reduced by letting AI automatically detect problems and pinpoints the root cause, explaining business impact with no manual configurations.
Objectives of this Lab
🔷 Enable a problem in the application and walk through what Dynatrace Davis found
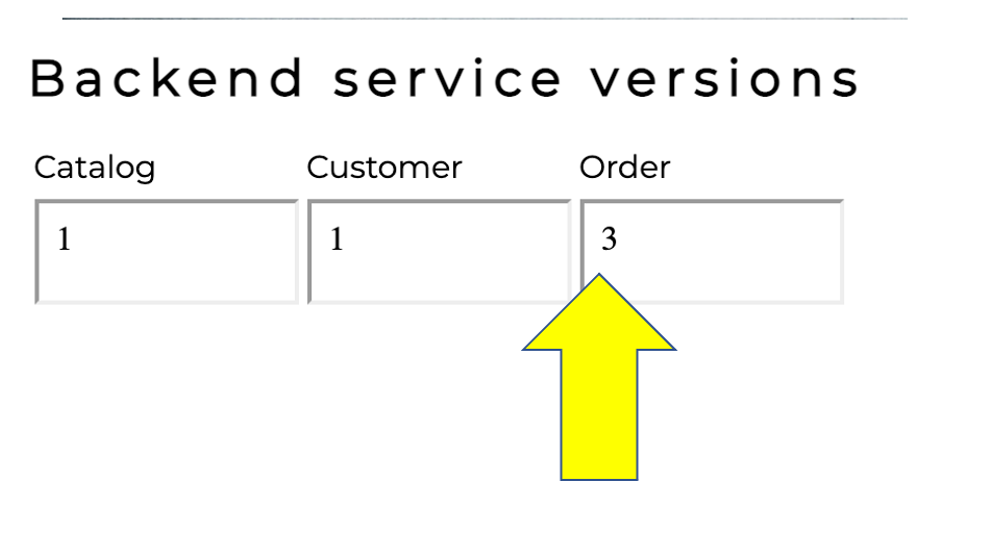
The Dynatrace Orders sample application has pre-built problems with different versions.
These problems can be enabled with a setversion URL that can be used to change the version and thus the behavior of the application. Version 1 is the "normal" behavior and problems are enabled by setting the version to a value such as 2 or 3.
In the next section, you will run a unix script that sets these problems.
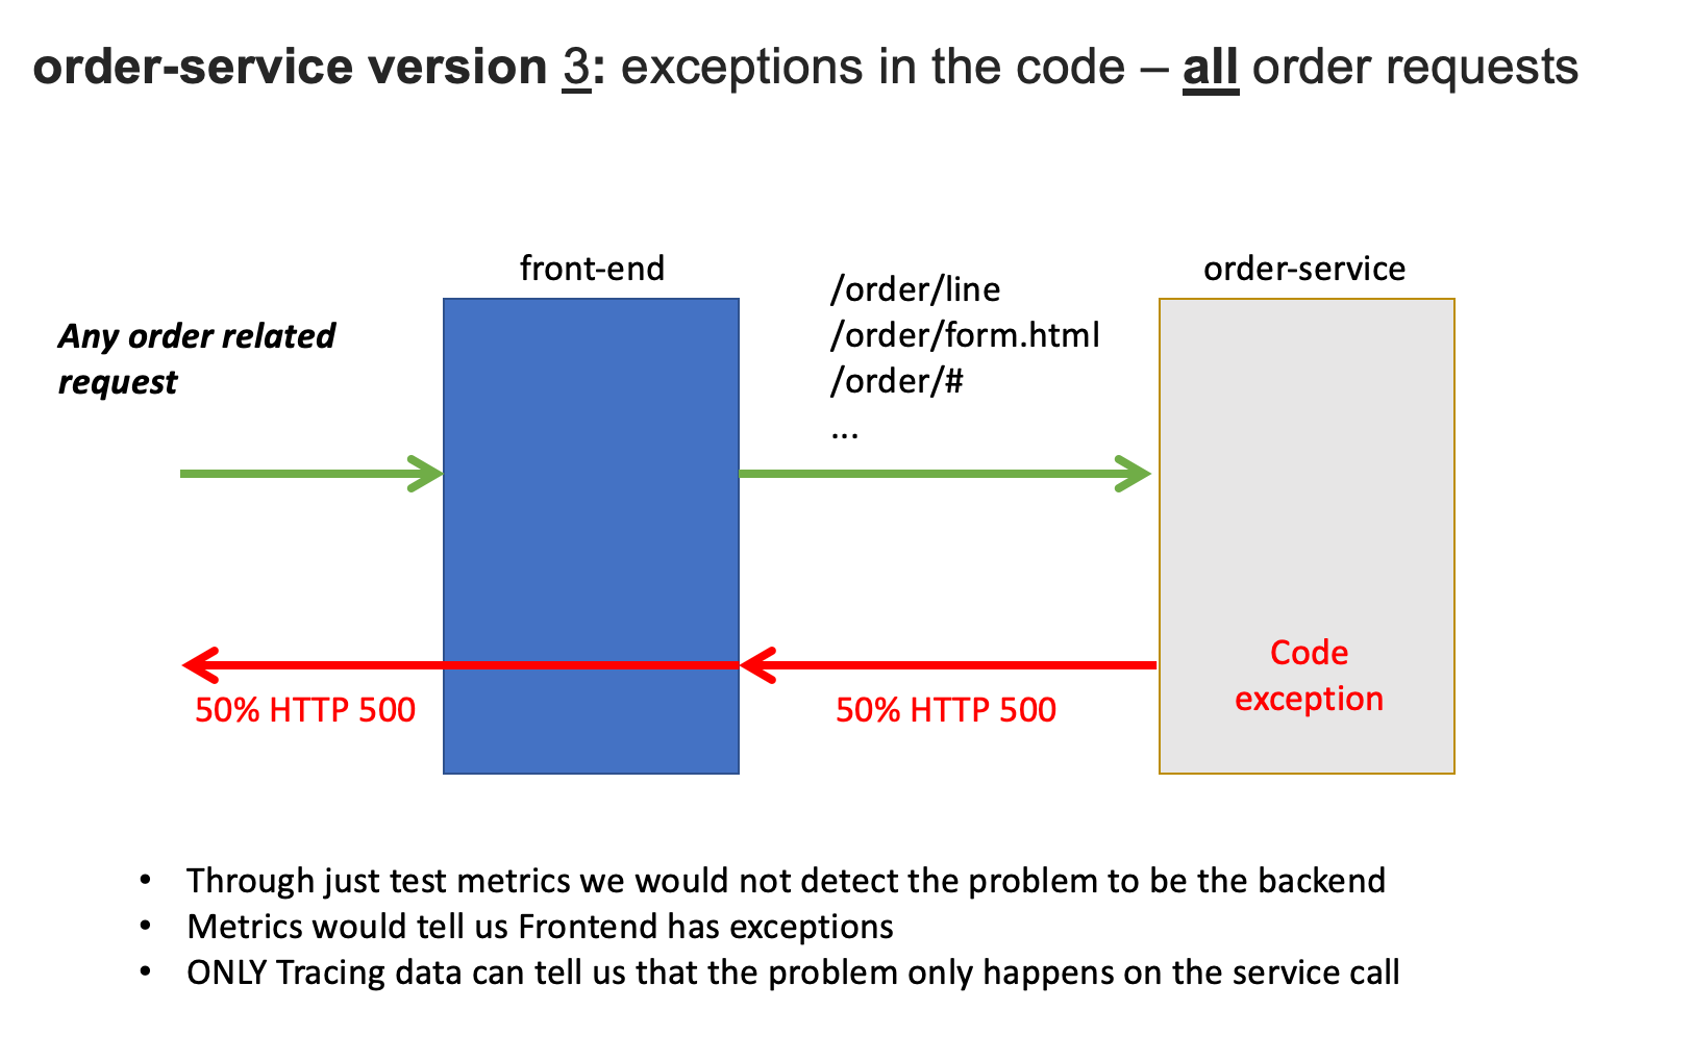
Now we are going to set the k8's order service version that will cause failures on the all requests.
To automate the version change, a unix script is provided that will do the following:
- Call the
order/setversionURL set the order-service version - Send a Dynatrace
CUSTOM_DEPLOYMENTevent indicating the change
After a minute or so, you should expect to see exceptions for all order related requests.
1. Enable the problem pattern
You will use the AWS Cloudshell to set the order service to version 3.
The argument for this depends on whether you do this on the Docker or the Kubernetes setup.
1 - For Kubernetes setup, run this command.
cd ~/aws-modernization-dt-orders-setup/learner-scripts/
./set-version.sh k8-order 3
Ensure there are numerical values at the end for Response Data: storedEventIds like:
Response Data
{"storedEventIds":[8663164135574257870,-5988376401319068441],"storedIds":["8663164135574257870_1628095127627","-5988376401319068441_1628095127627"],"storedCorrelationIds":[]}
2. View app in browser
The event has the URL back to the sample application, so just click that if you don't have the sample app up already. You should see version 3 for the order app now too.
3. Review problem in Dynatrace
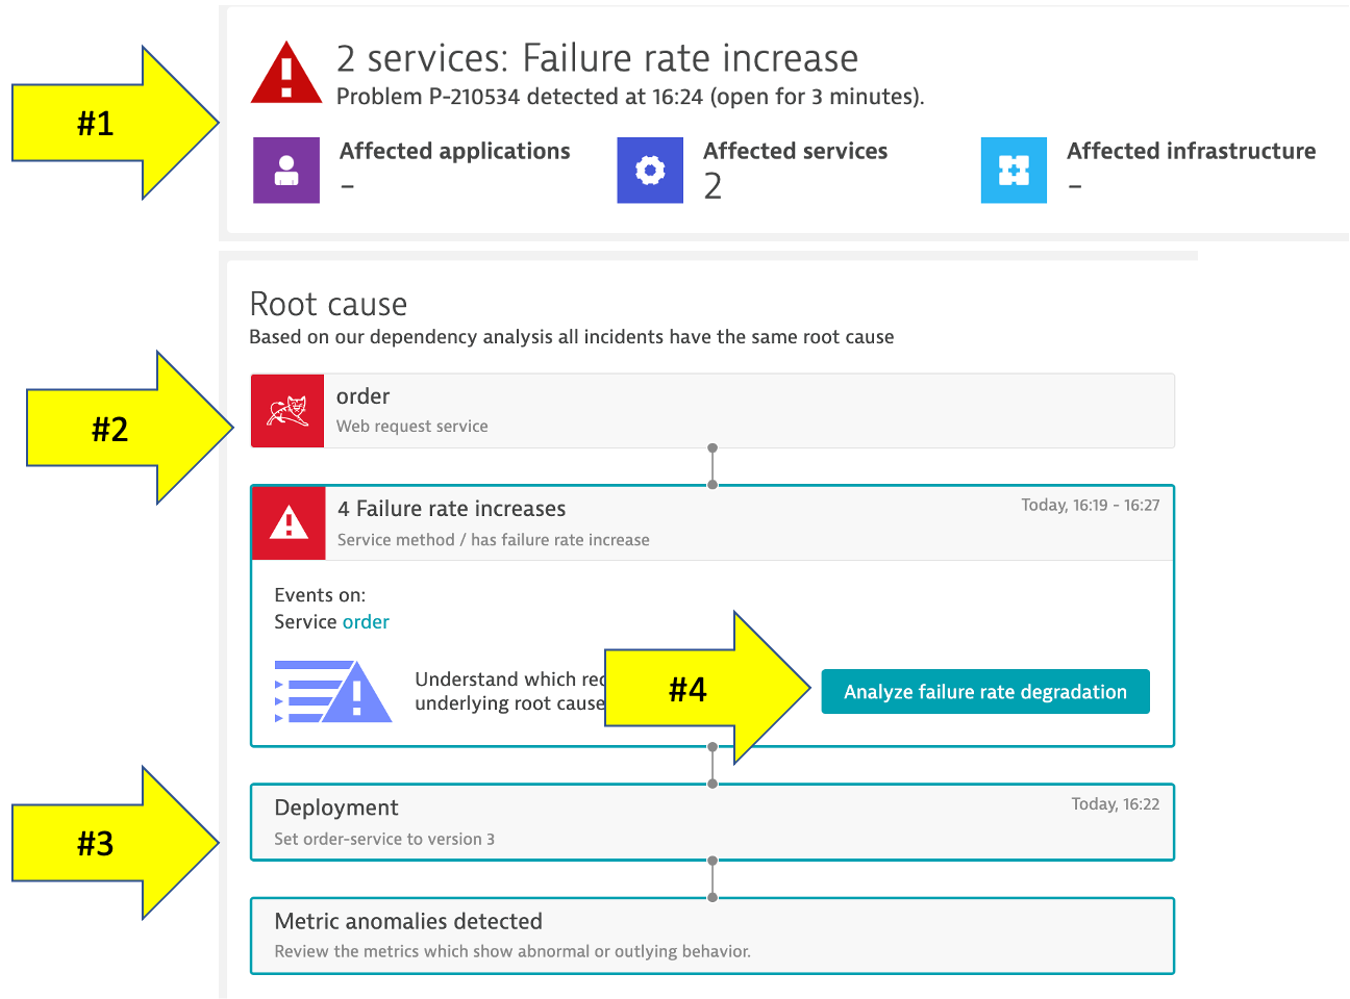
The problem may take a minute to show up, but this is what the problem will look like once it does. Also, you may see two problems that eventually get merged into one as Dynatrace is performing the problem analysis.
- Problem card windows and impact summary
- Root cause
- Deployment event as additional context
4. Analyze problem
Referring to #4 in the picture above, click on the Analyze failure rate degradation button.
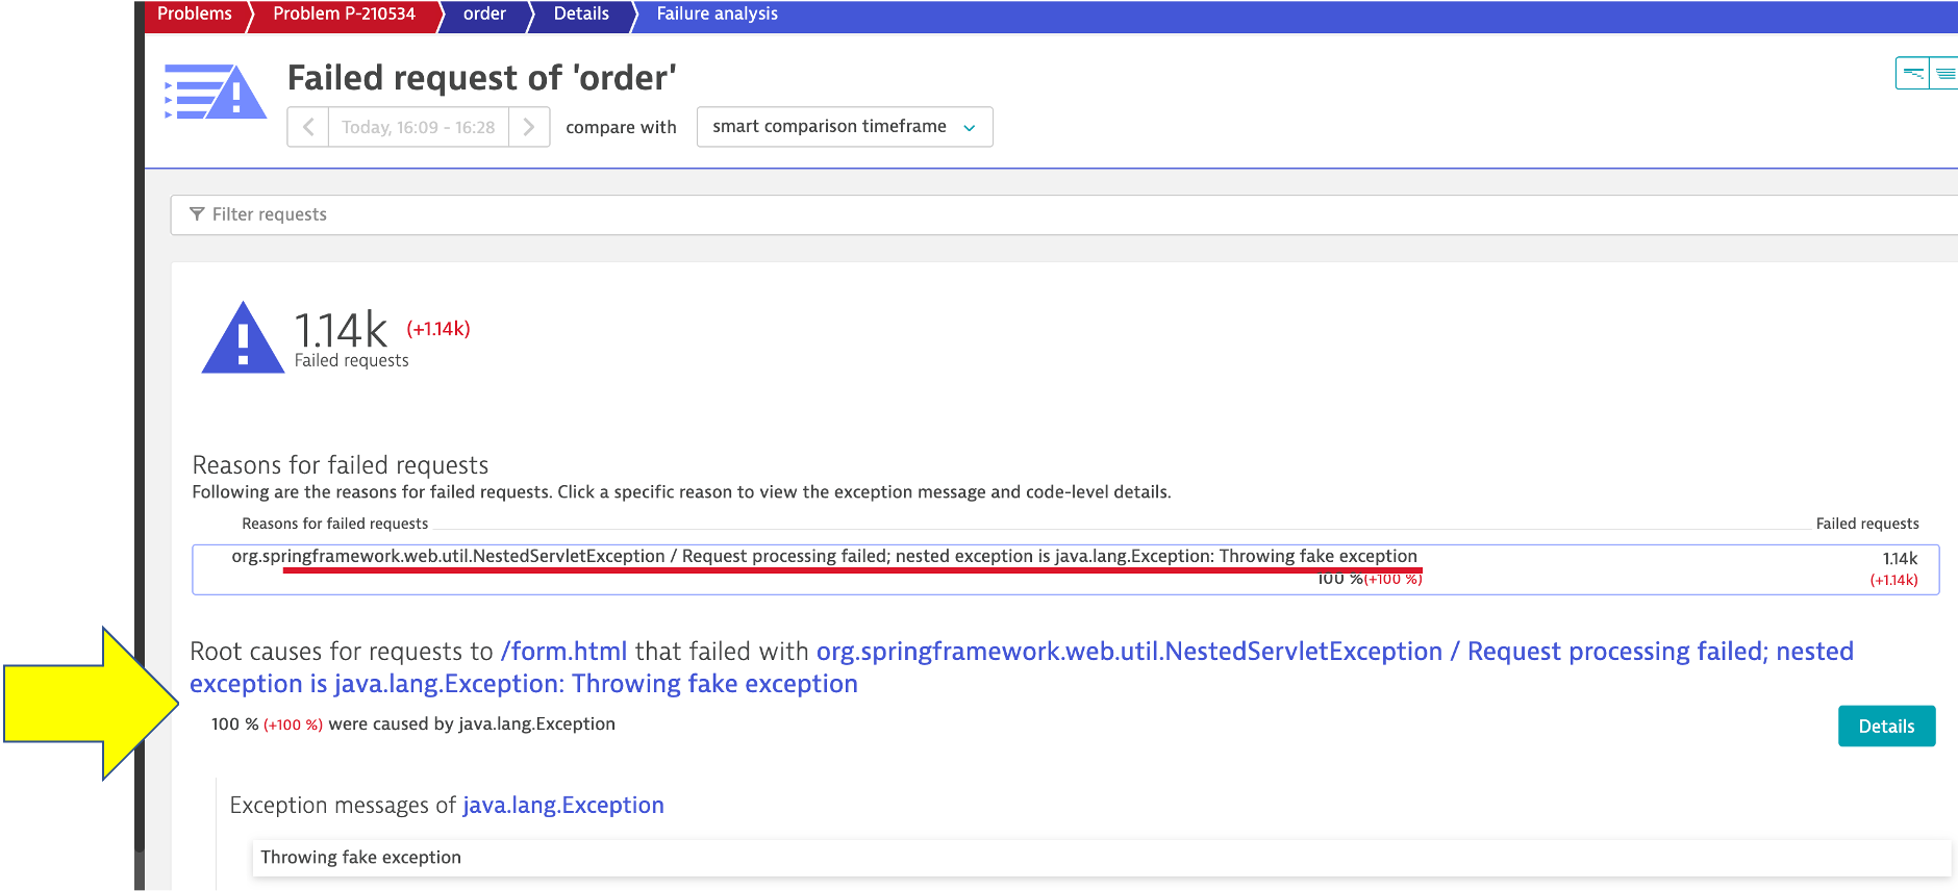
Right away we can see that there were exceptions in the code and the details button can be clicked to see the code stack trace.
5. Analyze problem impact
From the problem card click on the Kubernetes Service -> Order link from the Impacted Service box, next click on the order service in the related services section to open the service page. Notice the anomaly generated.
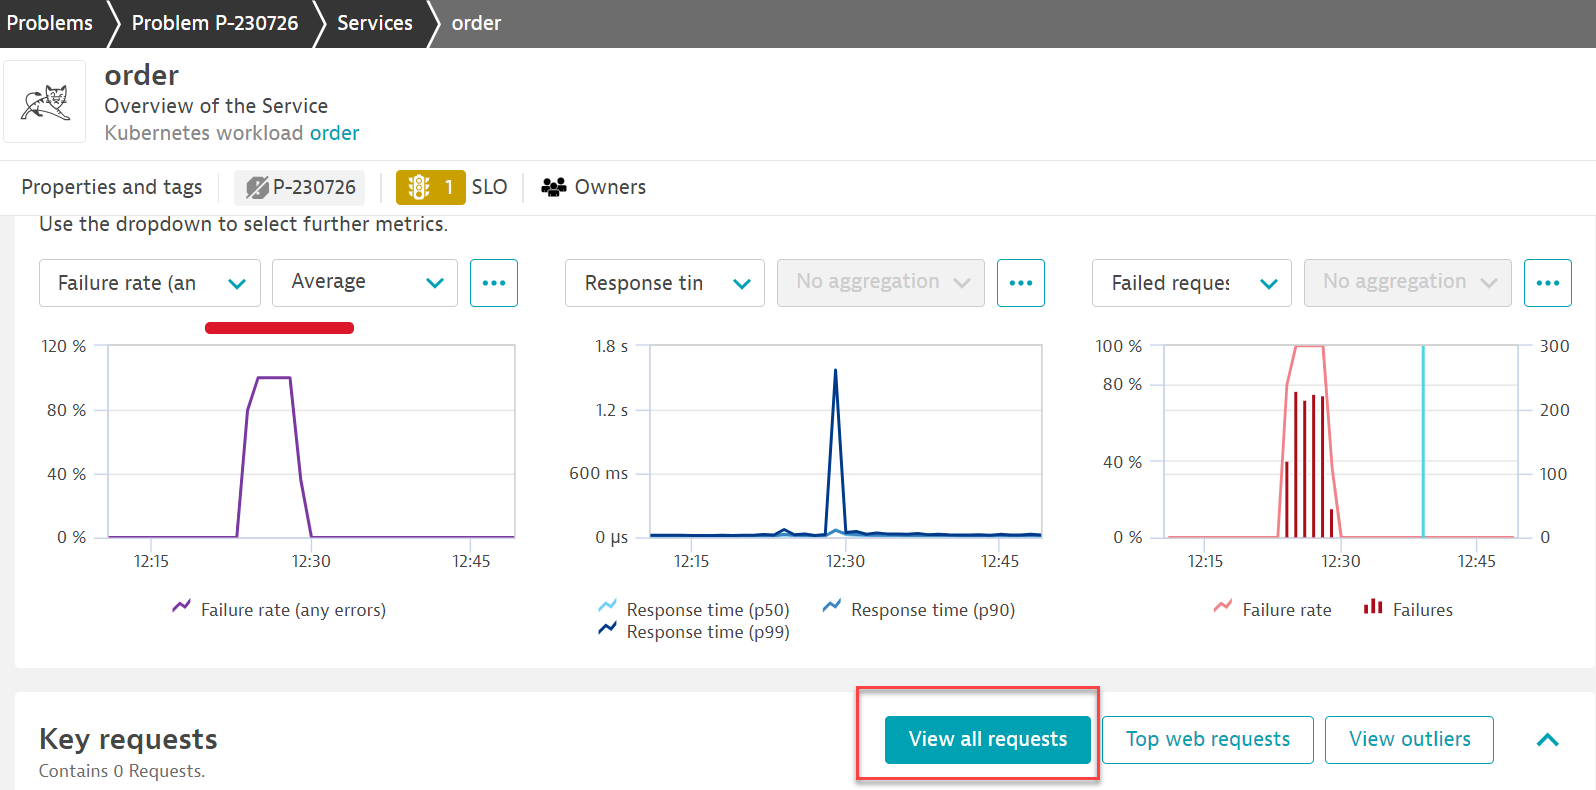
Next click on the view all request as pictured above to see a timeline of all the transactions on the order service.
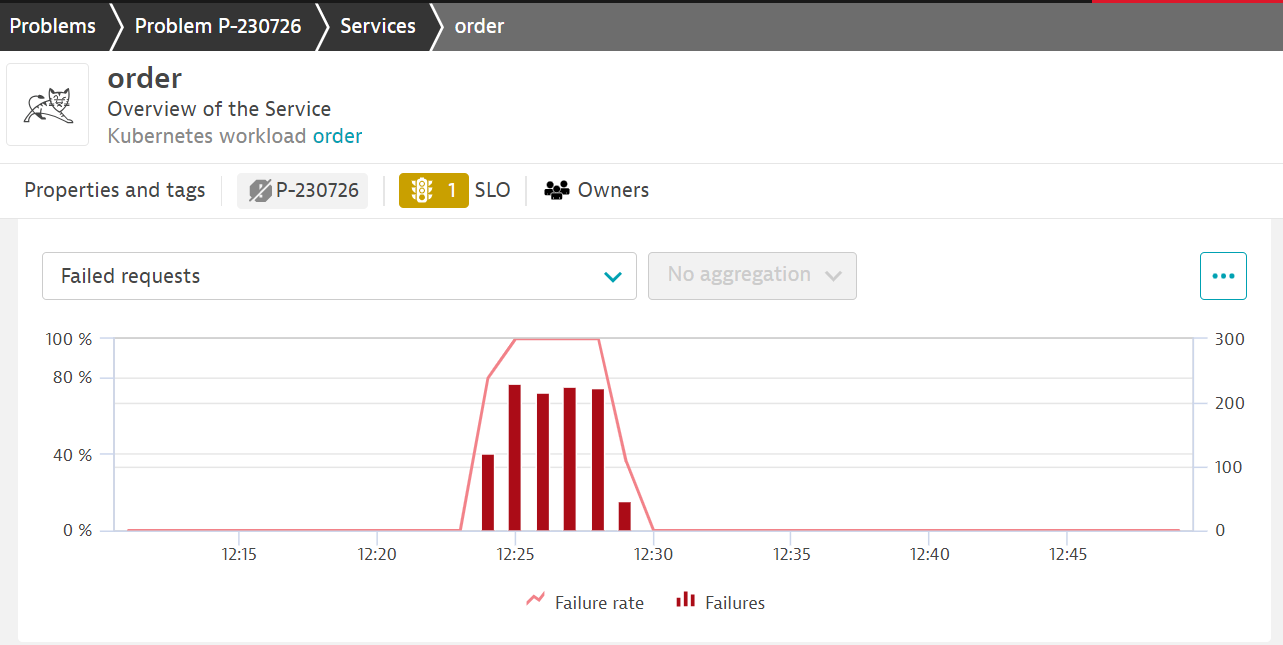
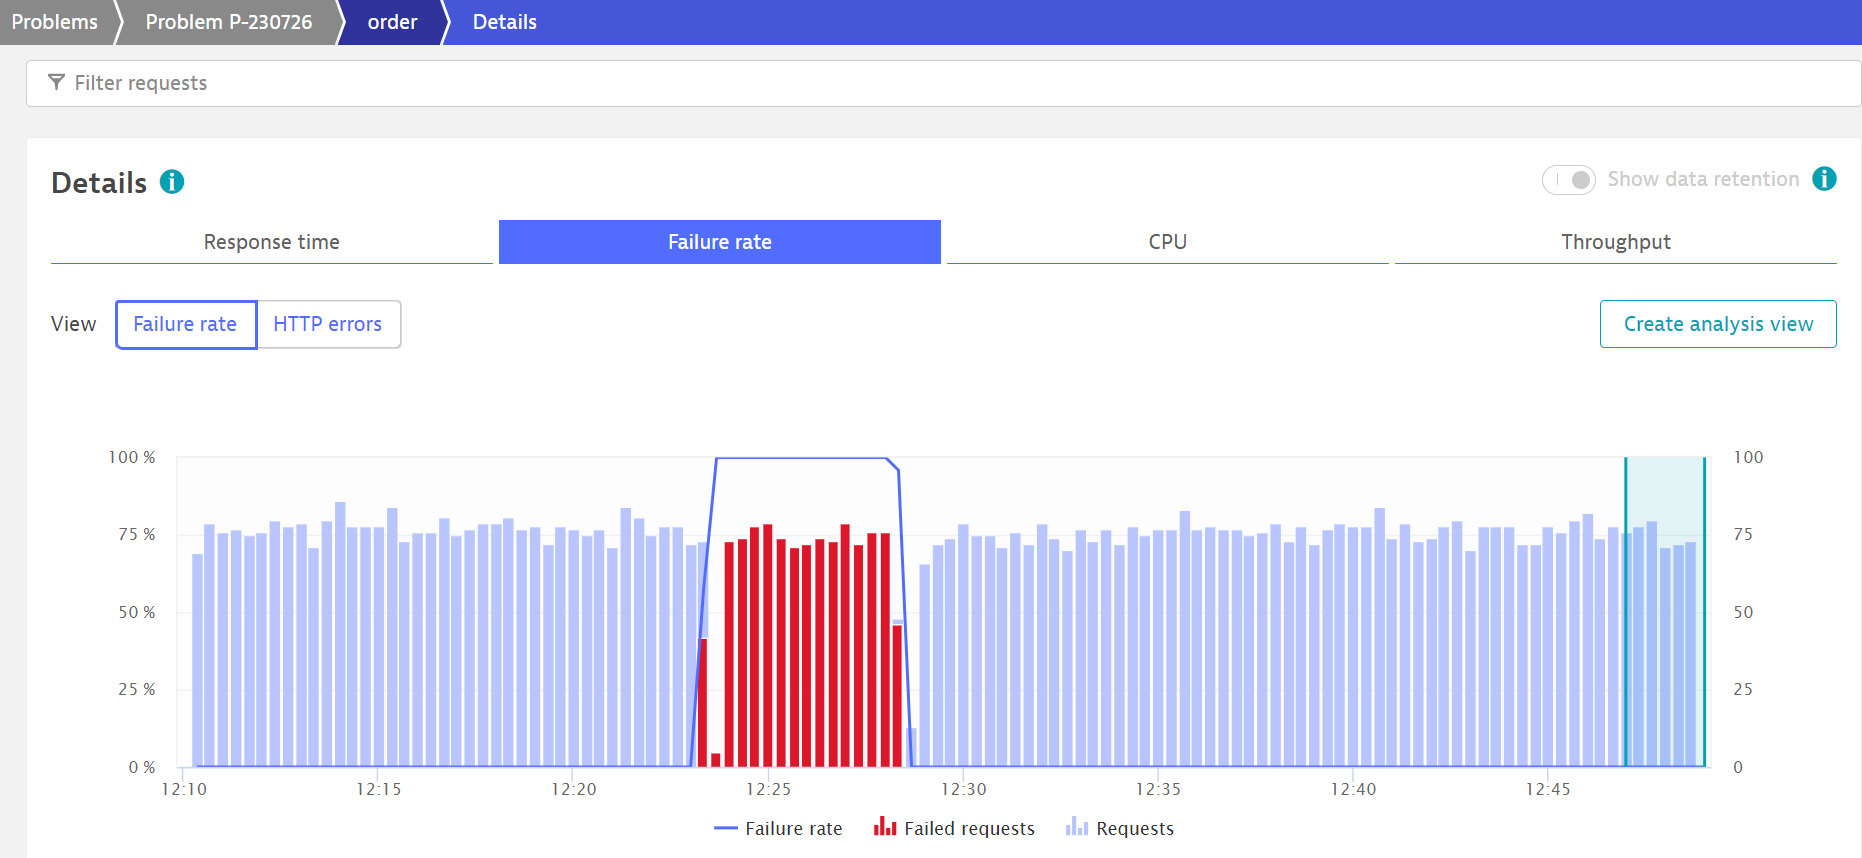
and select the failure rate tab so you can see exactly when the problem started.
6. Disable the problem pattern
From the Services host shell, run these commands to set the version back to version 1
For Kubernetes run this command.
cd ~/aws-modernization-dt-orders-setup/learner-scripts/
./set-version.sh k8-order 1
Dynatrace will automatically close the problem once it detects things are back to normal.
In this section, you should have completed the following:
✅ Enable a problem in the application and walk through what Davis AI found