🔷 Install the Dynatrace Operator and sample application
🔷 Review some use cases for Platform Ops MOnitoring
🔷 Review some use cases for Optimizing Kubernetes resources with Dynatrace
🔷 Examine the application using service flows and back traces
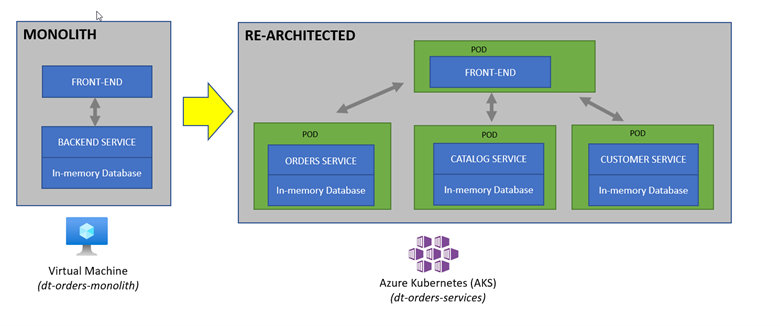
The sample application is a three-tiered application –> frontend, backend, database.
For our lab, another version of the application exists that breaks out each of these backend services into separate services. By putting these services into Docker images, we gain the ability to deploy the service into modern platforms like Azure Kubernetes and Cloud managed services such as the ones from Azure shown below.
The picture below shows how the components of the sample application interact with Dynatrace.
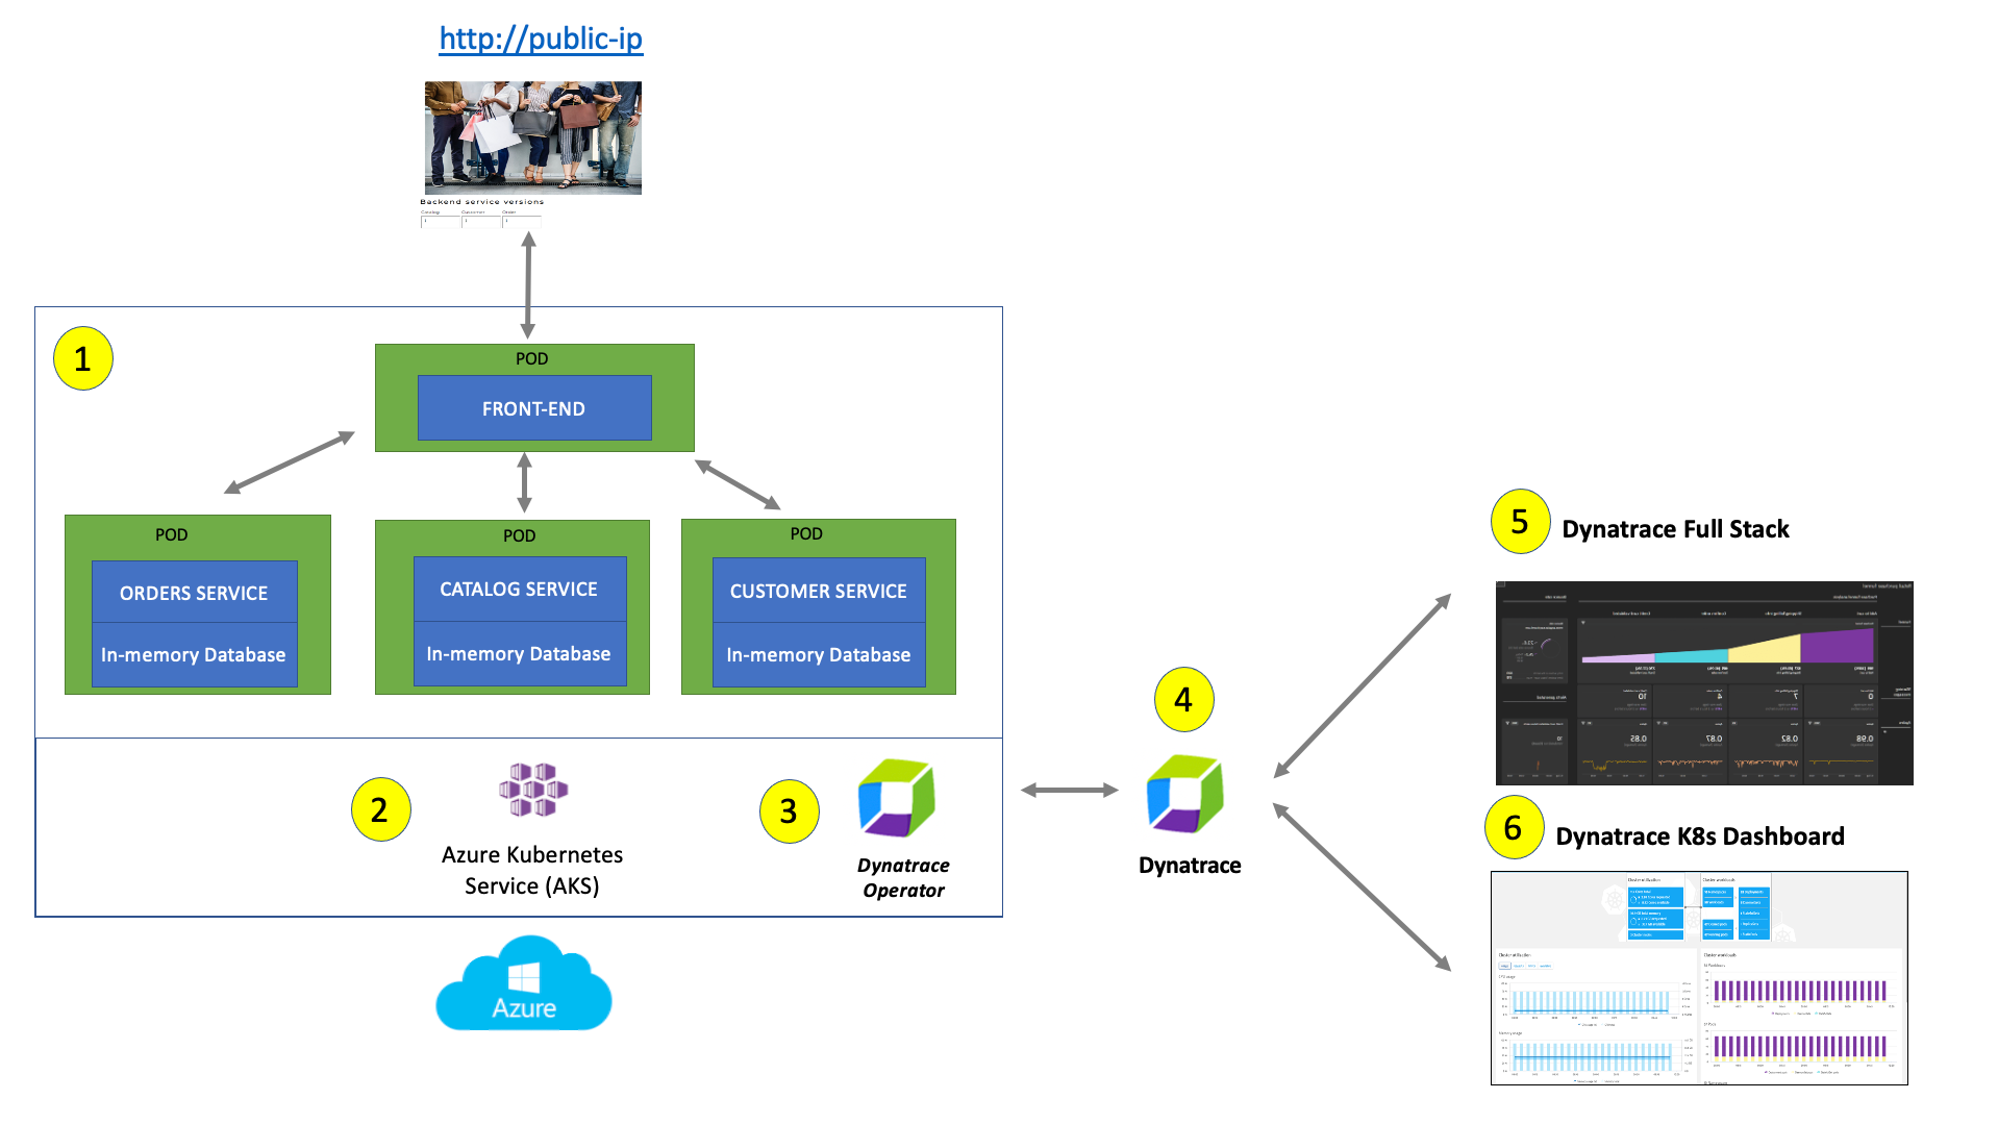
#1 . Sample Application - Representing a "services" architecture of a frontend and multiple backend services implemented as Docker containers that we will review in this lab.
#2 . Azure Kubernetes Service (AKS) - is hosting the application. The Kubernetes cluster had the Dynatrace OneAgent Operator installed. (see below for more details). Two AKS nodes make up the Kubernetes cluster. The Dynatrace OneAgent was preinstalled by the OneAgent operator and is sending data to your Dynatrace SaaS environment. (see below for more details)
#3 . Dynatrace Operator - Dynatrace OneAgent is container-aware and comes with built-in support for out-of-the-box monitoring of Kubernetes. Dynatrace supports full-stack monitoring for Kubernetes, from the application down to the infrastructure layer.
#4 . Dynatrace tenant is where monitoring data is collected and analyzed.
#5 . Full-Stack Dashboard - Made possible by the Dynatrace OneAgent that will automatically instrument each running node & pod in AKS.
#6 . Kubernetes Dashboard - The Kubernetes page provides an overview of all Kubernetes clusters showing monitoring data like the clusters' sizing and utilization.
Overview
One key Dynatrace advantage is ease of activation via Azure Portal. OneAgent technology simplifies deployment across large enterprises and relieves engineers of the burden of instrumenting their applications by hand. As Kubernetes adoption continues to grow, it becomes more important than ever to simplify the activation of observability across workloads without sacrificing the deployment automation that Kubernetes provides. Observability should be as cloud-native as Kubernetes itself.
Dynatrace offers a fully automated approach to infrastructure and application observability including Kubernetes control plane, deployments, pods, nodes, and a wide array of cloud-native technologies. Dynatrace furthers this automated approach by providing unprecedented flexibility for organizations that need to onboard teams as quickly as possible. The foundation of this flexibility is the Dynatrace Operator and its new Cloud Native Full Stack injection deployment strategy.
Organizations will often want to customize the Dynatrace Operator installation and you can read more about the options in the Dynatrace Doc but, we are going to use a single command that we can get from the Dynatrace interface to show how easy it is to get started.
Tasks to complete this step
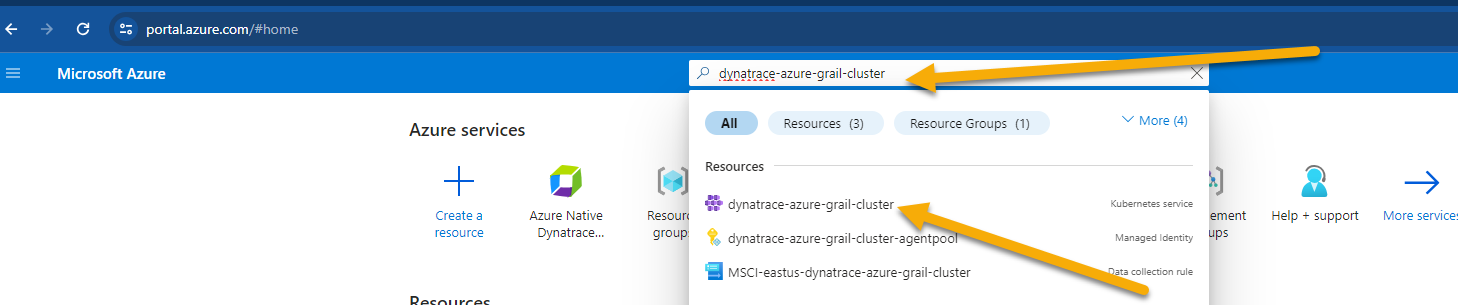
- Open up the Azure Portal and search for the AKS Cluster from the top search bar and select it once it displays under resources
- Once you're on the AKS cluster, from the left navigation, go to
Settings -> Extensions + Applications - Click on
Install an extension.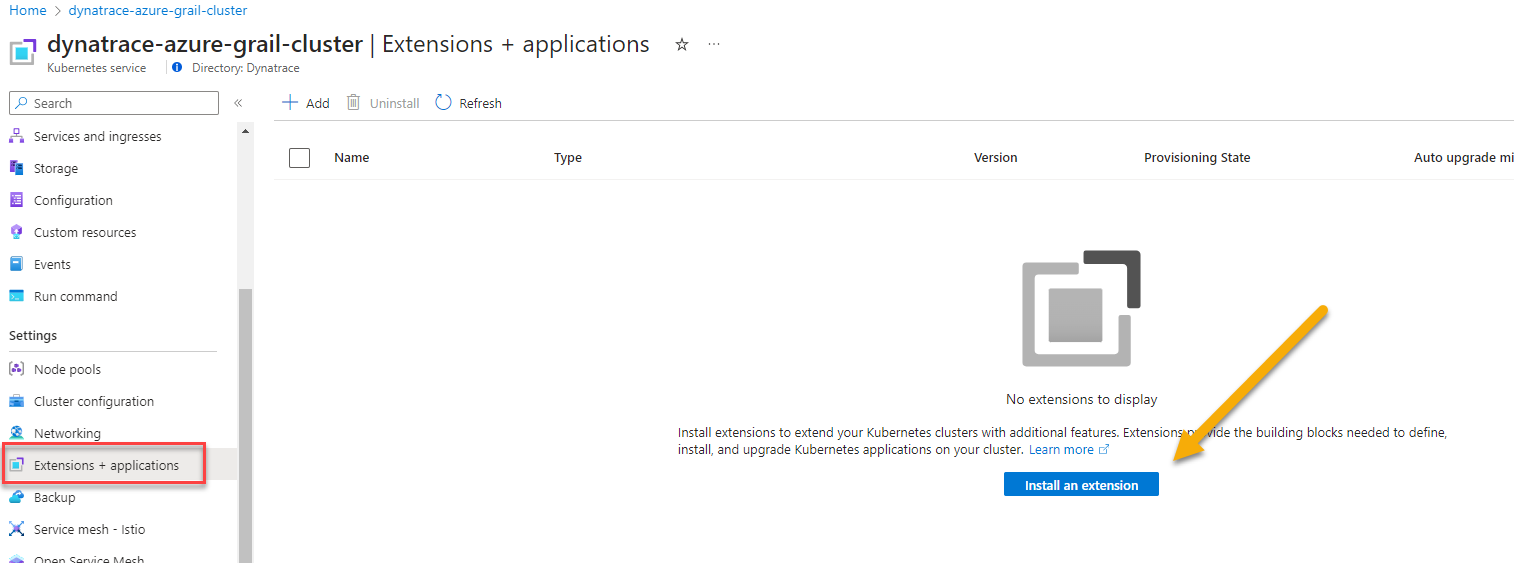
- Search Dynatrace in search bar. Click on Dynatrace Operator tile once its displayed.
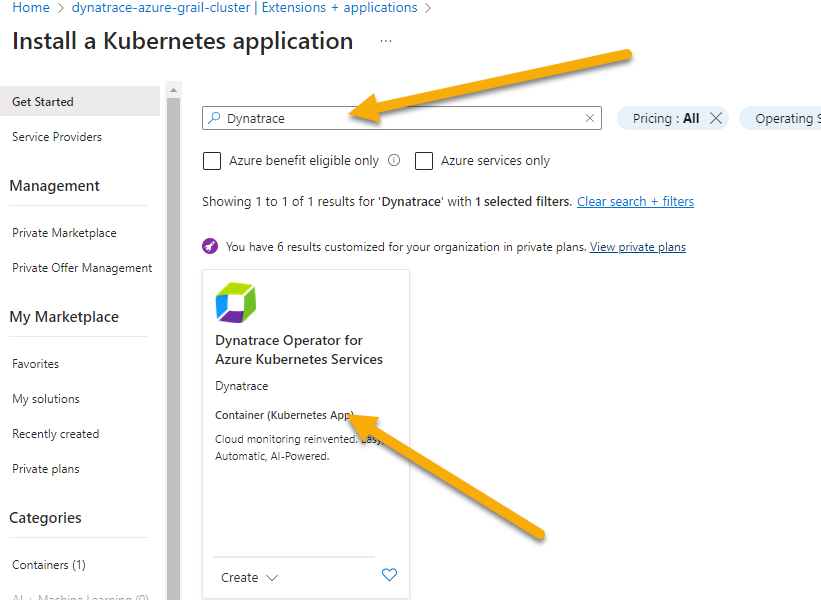
- Click create at the next screen
- On the
Basicstab, the subscription and resource group shold already be pre-selected. Just select the AKS Cluster from the drop down.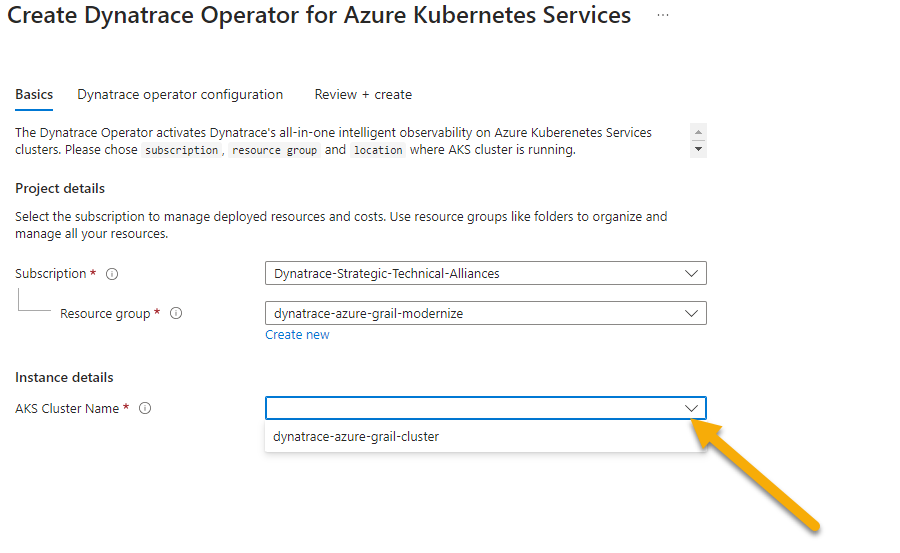
- On the
Dynatrace Operator Configurationhere are the values to fill inAKS extension resource name: dynatraceazuregrailDynatrace operator token: token value from notepad saved from earlier stepData ingest token: token value from notepad saved from earlier stepAPI URL: URL value from notepad saved from earlier stepOneAgent Deployment Type: cloud native full stack
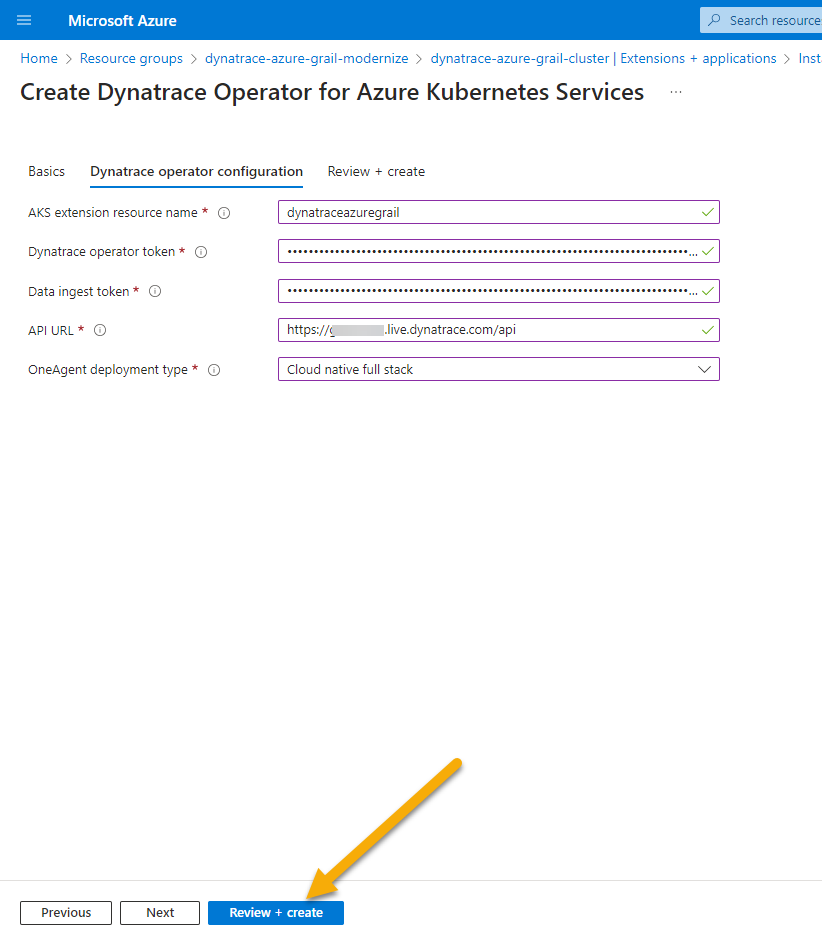
- Click on
Review + Createand clickCreateon the next screen. - After the deployment is complete, go into Dynatrace -> From the left menu select
Appsand bring upKubernetes Classicapp.- Within a couple of minutes, you will see the cluster and some of the metrics start to show up.
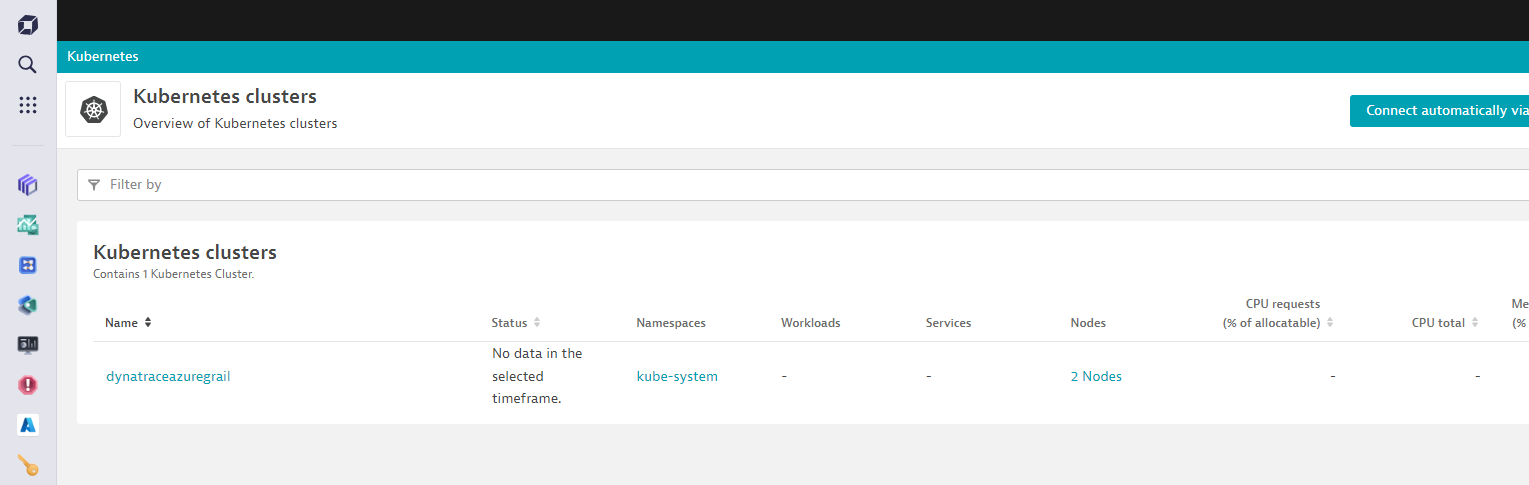
- Within a couple of minutes, you will see the cluster and some of the metrics start to show up.
Overview
In this step we will walk through the new Kubernetes experience which is optimized for DevOps Platform Engineers and Site Reliability Engineers (SREs), focusing on the health and performance optimization of multicloud Kubernetes environments. The underlying metrics, events, and logs are all powered by Grail, which supports flexible analytics through the Dynatrace Query Language in Notebooks, Dashboards, and Workflows.
We will use The Kubernetes app to gain clear insights into cluster health, helping you identify and address issues, and ensuring your clusters are functioning efficiently.
Tasks to complete this step
- Bring up the Kubernetes app in Dynatrace by going to left Navigation Menu and select
Apps -> Kubernetes. Alternatively you should see Kubernetes app also visibile under thePinnedsection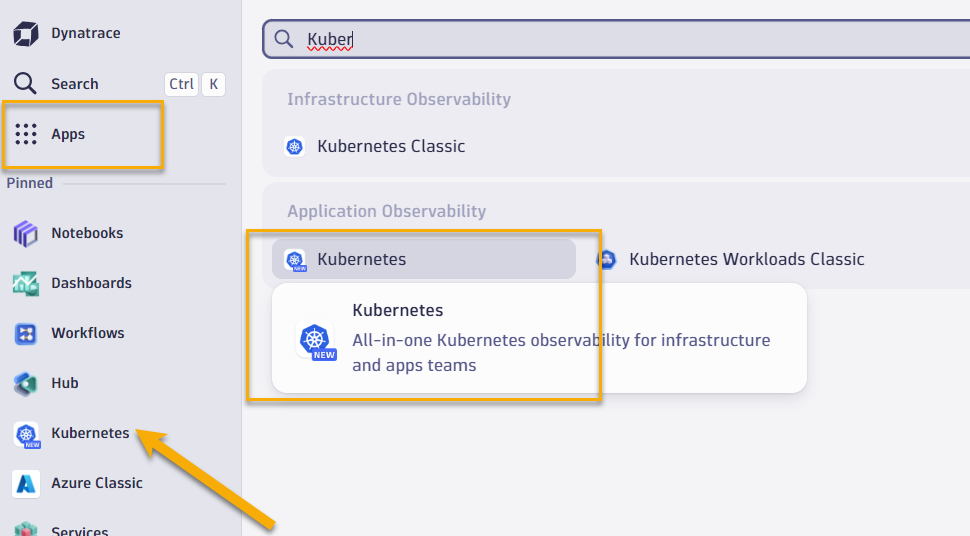
- Click on Explorer from the top to view all of the AKS clusters this Sandbox environment is currently monitoring

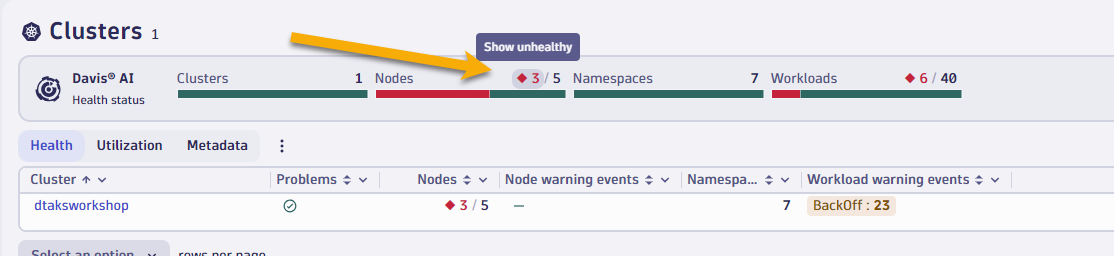
- Select the red number under nodes to quickly assess which of your nodes are unhealthy
- Click on Explorer view from the top menu
- Select the
dtaksworkshopcluster and let's quickly walk through some of the screens.- Overview screen shows up high level cluster utilization, # of nodes, number of worksloads and if any of them have any outstanding problems.
- Logs screen shows you types of logs (ERROR, WARN, etc) over the last hour. You can click on
Run Queryto quickly shop the last 100 errors and warnings log details - Events screen will show any K8 events details
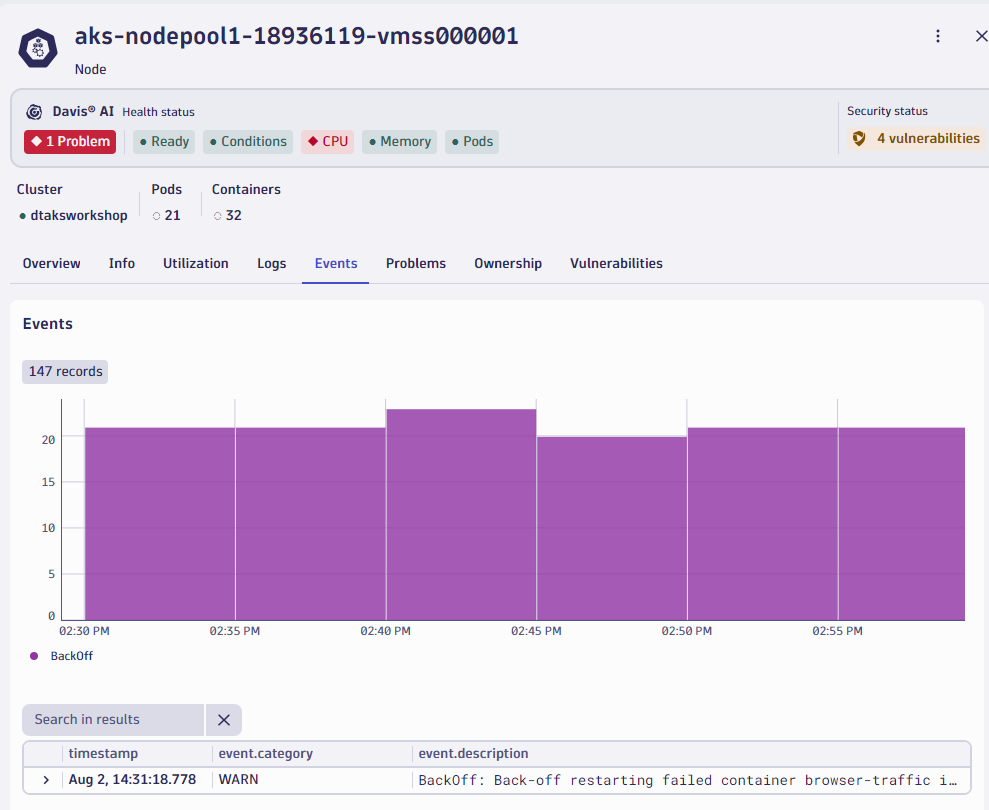
- Now let's focus on one of the problem nodes in our cluster. Select the red number under nodes to quickly filter down your view to assess which of your nodes are unhealthy.
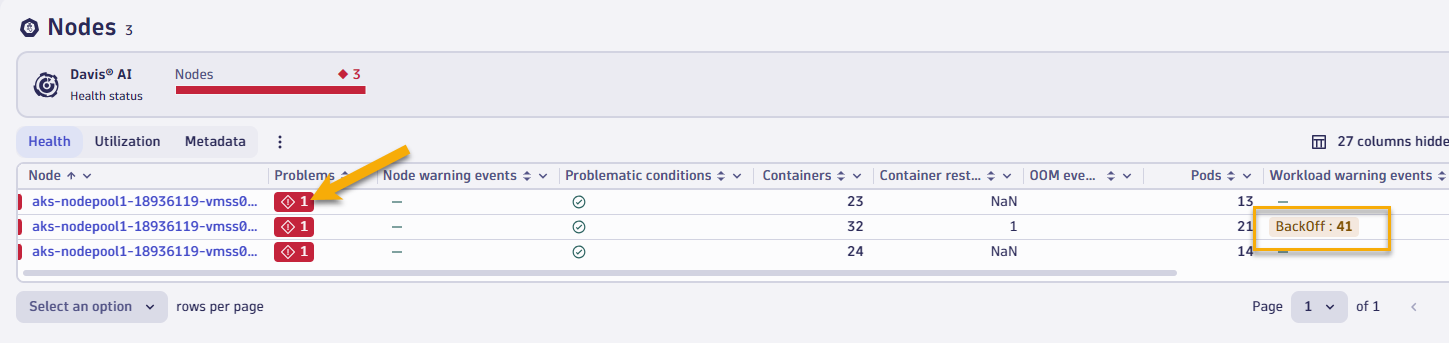
- You will notice in this view that we also show you any kubernetes events that contribute to unhealthiness, such as Backoff events from pods.
- If you click on problem for 2nd node, you'll quick the details of why this node is healthy (CPU saturation)
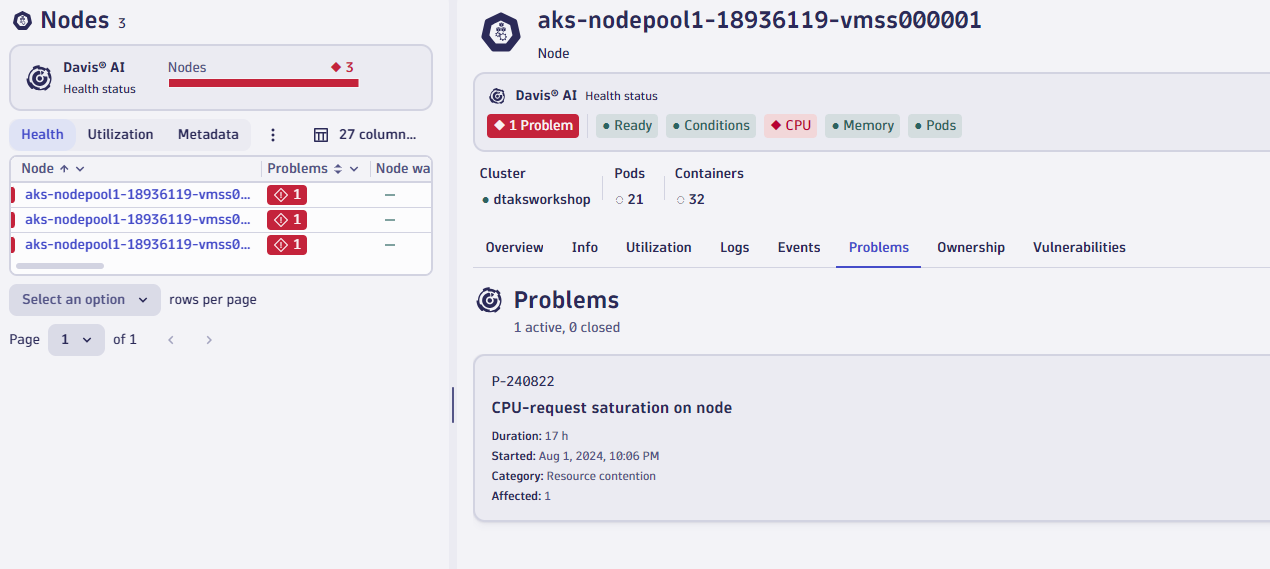
- If we quickly switch over to the events tab you can quickly see all of the Kubernetes events that were triggered on this node (such as Backoff event for pod)
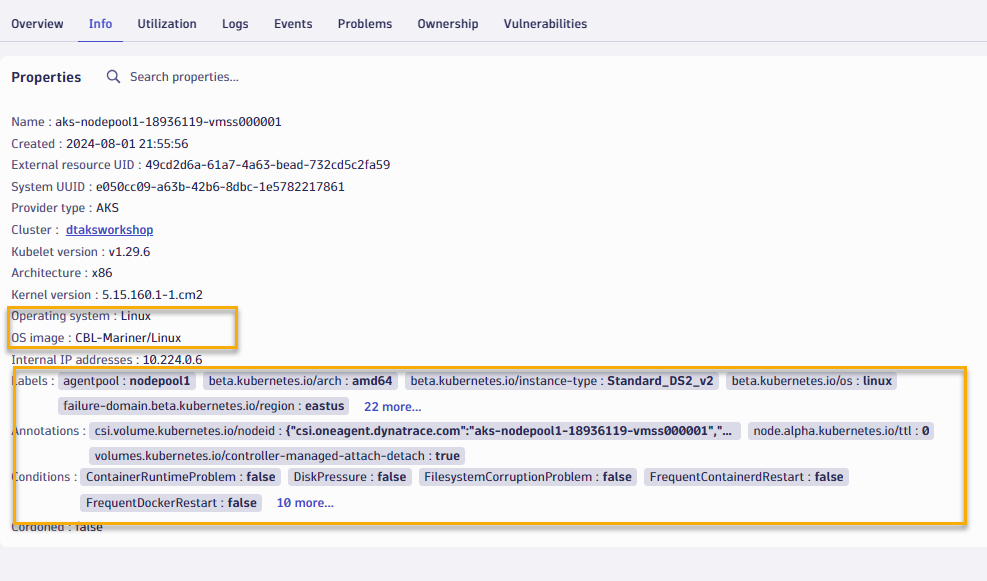
- We can quickly view other metadata about this node as well, such as what OS, K8 version, Labels, Annotations, etc
Overview
Maximize your cluster resources and reduce costs by identifying and optimizing underutilized workloads. Leverage the Kubernetes app alongside advanced queries in Notebooks, powered by data from Grail, for precise resource allocation suggestions.
Tasks to complete this step
- In Kubernetes app, go to the explorer view and then select the
dtaksworkshopcluster click onView workloads list.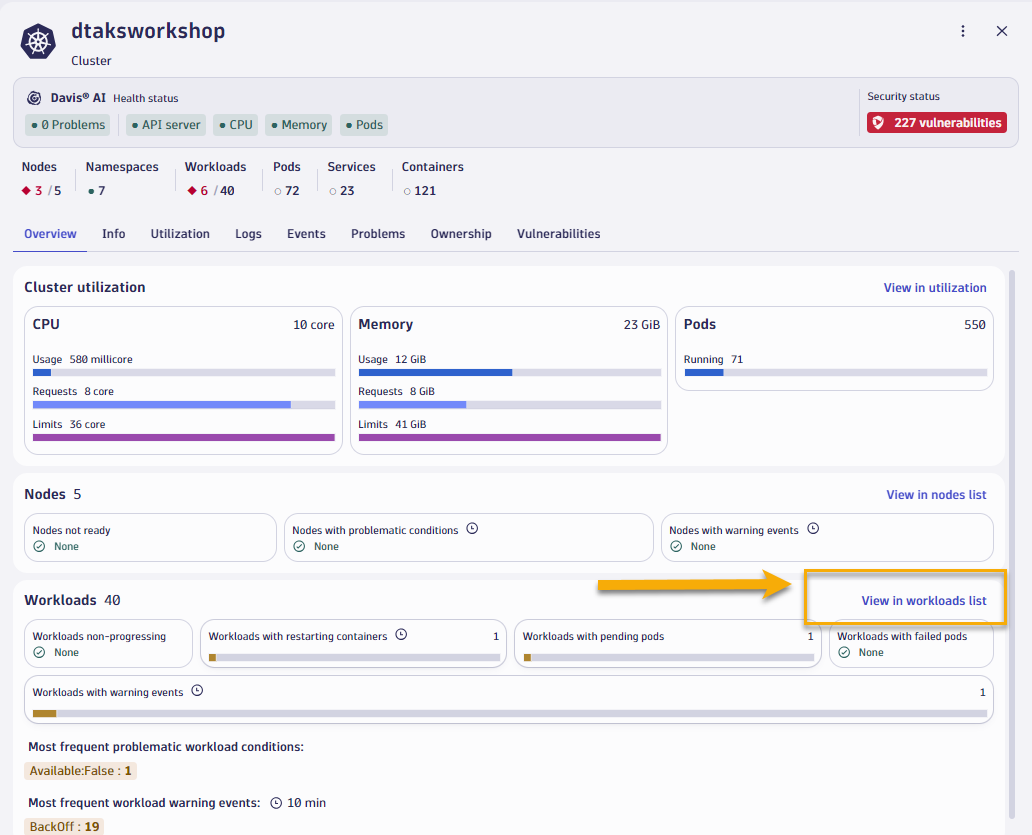
- Let's apply a couple of filter, one to look at only health workloads, second to look workload from
hipstershopnamespace
- Switch over the Utilization tab and sort by CPU Usage, assending
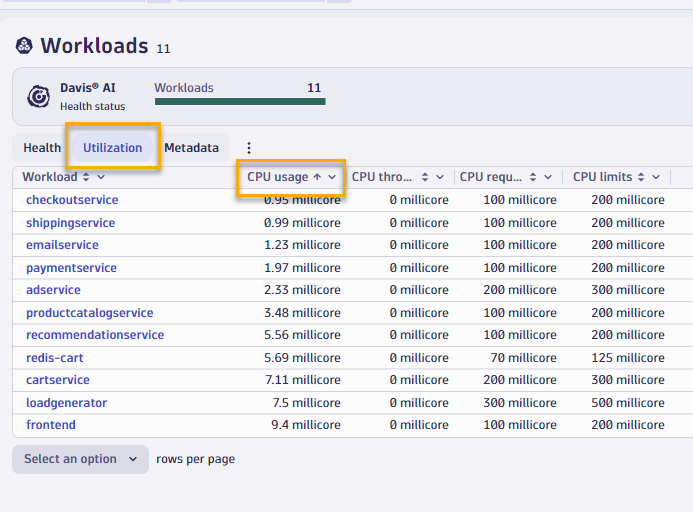
- You will quickly see that the
checkoutservicesorts to the top and if you click into to look at resource utilization details, you'll notice that the service only uses 1 millicore of CPU and 12mb of memory, but actually the cpu and memory limits are much higher.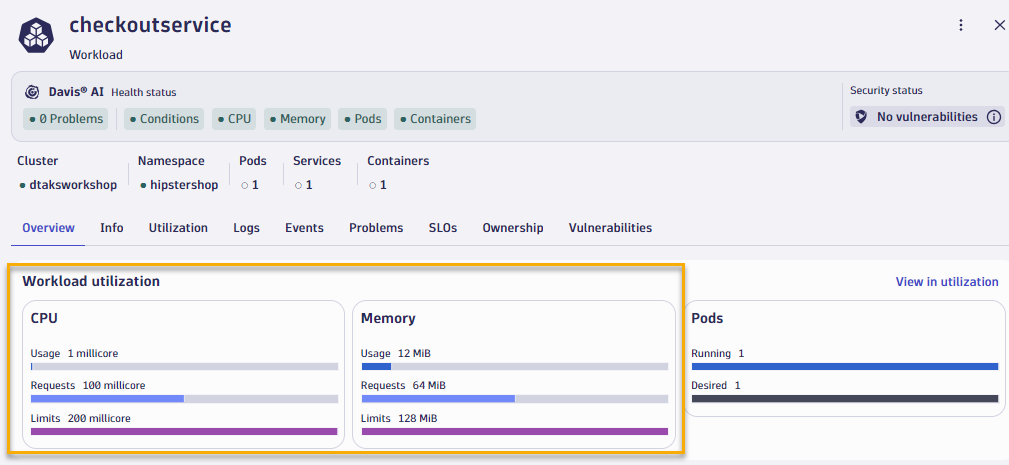
- To verify the consistency of usage patters, you can swith to the Utilization tab.
- If you need to identify which workloads lack requests or limits, there's simple Dynatrace Query Language (DQL) you can run to identify those 😉
- Open up Notebooks app from the left navigation, create a new notebook, add DQL element, and copy/paste the DQL below. into it.
fetch dt.entity.cloud_application, from: -30m | fields id, workload.name = entity.name, workload.type = arrayFirst(cloudApplicationDeploymentTypes), cluster.id = clustered_by[dt.entity.kubernetes_cluster], namespace.name = namespaceName
| lookup [
fetch dt.entity.kubernetes_cluster, from: -30m | fields id, cluster.name = entity.name, cluster.distribution = kubernetesDistribution, cluster.cluster_id = kubernetesClusterId | limit 20000
], sourceField:cluster.id, lookupField:id, fields:{cluster.name}
| fieldsRemove cluster.id
| filterOut  namespace.name == "kube-system"
| lookup [
timeseries values = sum(dt.kubernetes.container.requests_CPU), by:{dt.entity.cloud_application}, from: -2m, filter: dt.kubernetes.container.type == "app"
| fieldsAdd requests_CPU = arrayFirst(values)
| limit 20000
], sourceField:id, lookupField:dt.entity.cloud_application, fields:{requests_CPU}
| lookup [
timeseries values = sum(dt.kubernetes.container.requests_memory), by:{dt.entity.cloud_application}, from: -2m, filter: dt.kubernetes.container.type == "app"
| fieldsAdd requests_memory = arrayFirst(values)
| limit 20000
], sourceField:id, lookupField:dt.entity.cloud_application, fields:{requests_memory}
| filter isNull(requests_CPU) or isNull(requests_memory)
- Open up Notebooks app from the left navigation, create a new notebook, add DQL element, and copy/paste the DQL below. into it.
While migrating to the cloud, you want to evaluate if your migration goes according to the plan, whether the services are still performing well or even better than before, and whether your new architecture is as efficient as the blueprint suggested. Dynatrace helps you validate all these steps automatically, which helps speed up the migration and validation process.
Having the ability to understand cluster health, application service flows enables us to make smarter re-architecture and re-platforming decisions. With support for new technologies like Kubernetes, you have confidence to modernize with a platform that spans the old and the new.
Checklist
In this section, you should have completed the following:
✅ Installed Dynatrace Operator on Azure Kubernetes cluster via Azure Portal
✅ Review real-time data now available for the sample application on Kubernetes
✅ Review Kubernetes App within Dynatrace