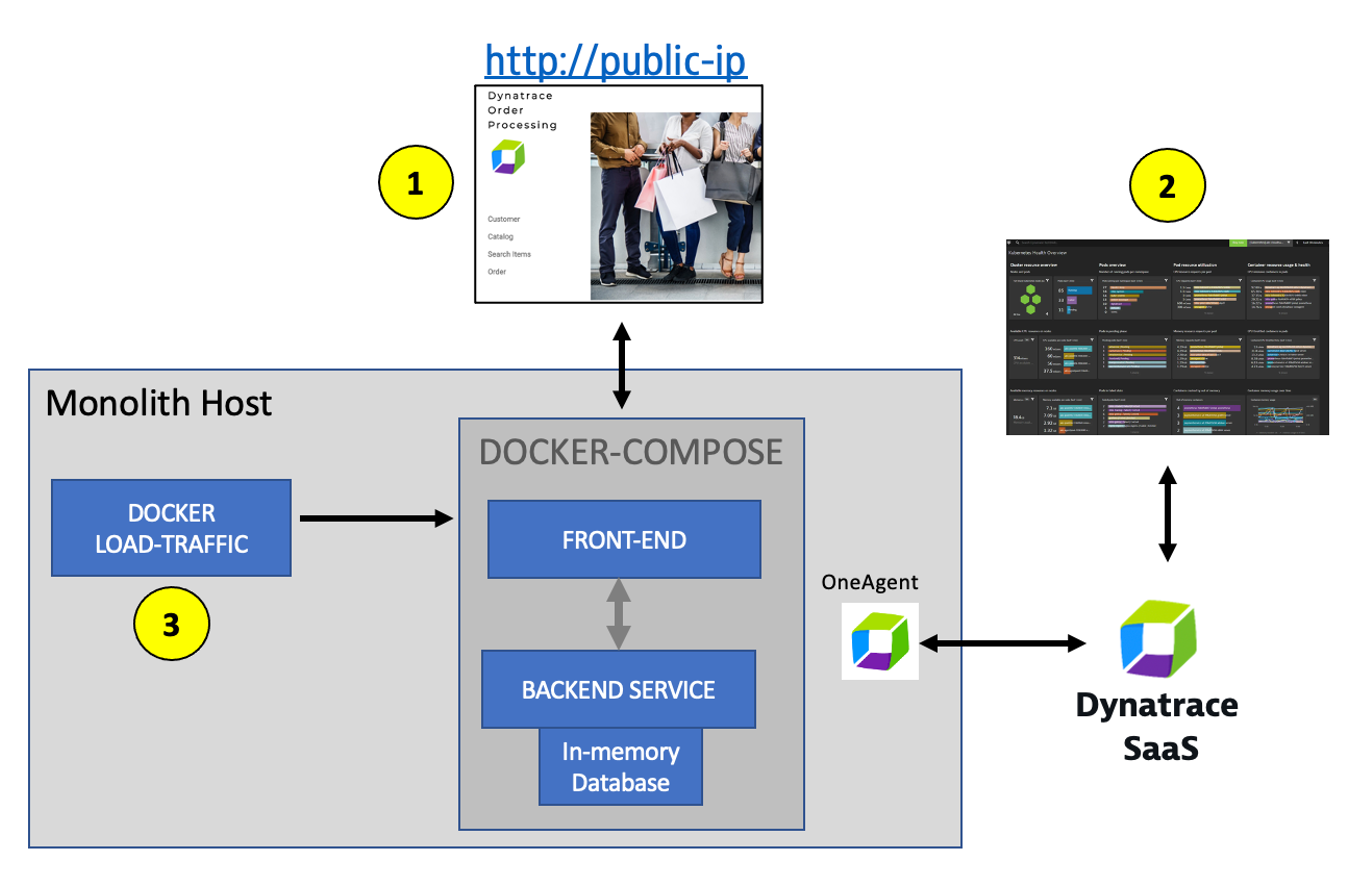
Referring to the picture below, here are the components for lab 1.
#1 . Sample Application
Sample app representing a simple architecture of a frontend and backend implemented as Docker containers that we will review in this lab.
#2 . Dynatrace monitoring
The Dynatrace OneAgent has been installed by the workshop provisioning scripts and is communicating to your Dynatrace tenant.
#3 . Load generator process
A docker processes that sends simulated user traffic to the sample app using Jmeter run within a Docker container. You will not need to interact with this container; it just runs in the background.
The host running the sample application was created using scripts to install and run the Sample Application and to install the Dynatrace OneAgent.
All these scripts you can review here within the provision-scripts subfolder.
Tasks to complete this step
Review OneAgent Status for Monolith VM
- Login into Dynatrace UI
- From the left menu, Choose the
Apps -> Deployment Statusto open the OneAgent deployment app. - Check to ensure the
dt-orders-monolithVM is reporting in under OneAgents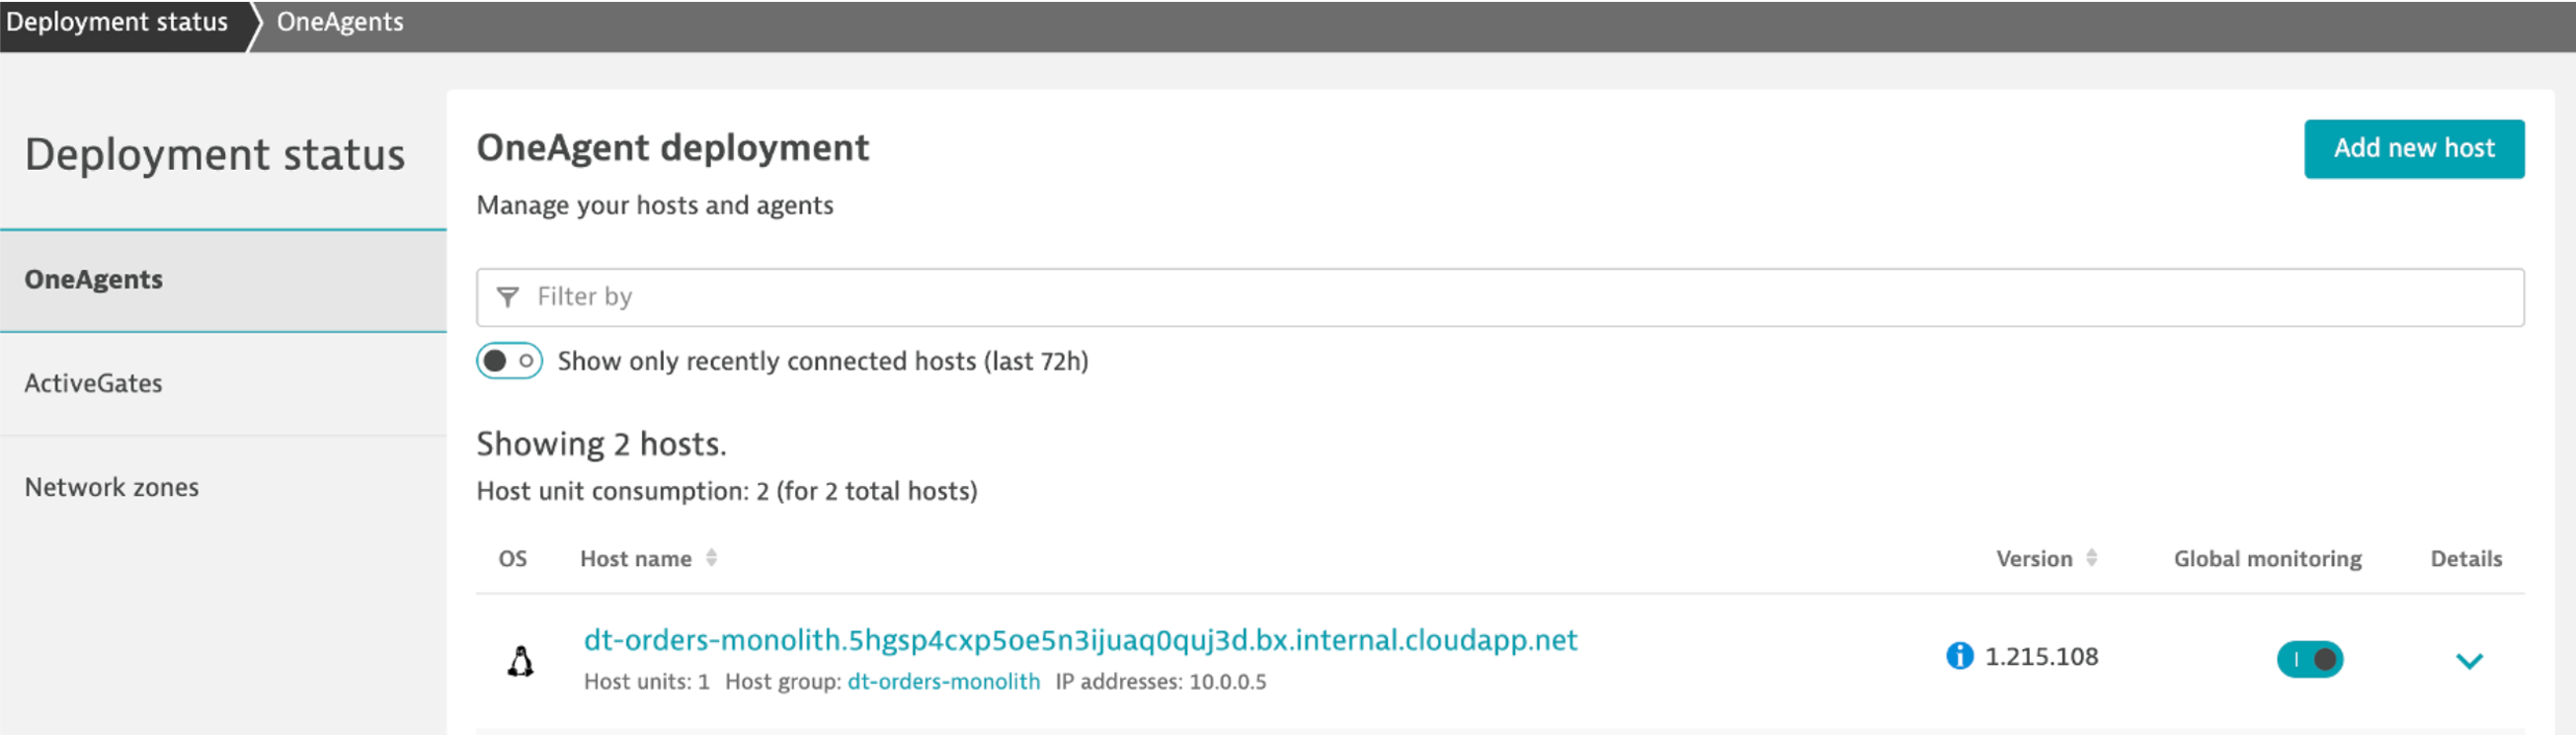
The sample application is called Dynatrace Orders. A more detailed overview can be found here - https://github.com/dt-orders/overview.
All the source code can be found here - https://github.com/dt-orders
Tasks to complete this step
- Get the Public IP to the frontend of the Sample Application
- Open up the Azure Portal and navigate to the Virtual Machine page. You can use the search feature as shown below.
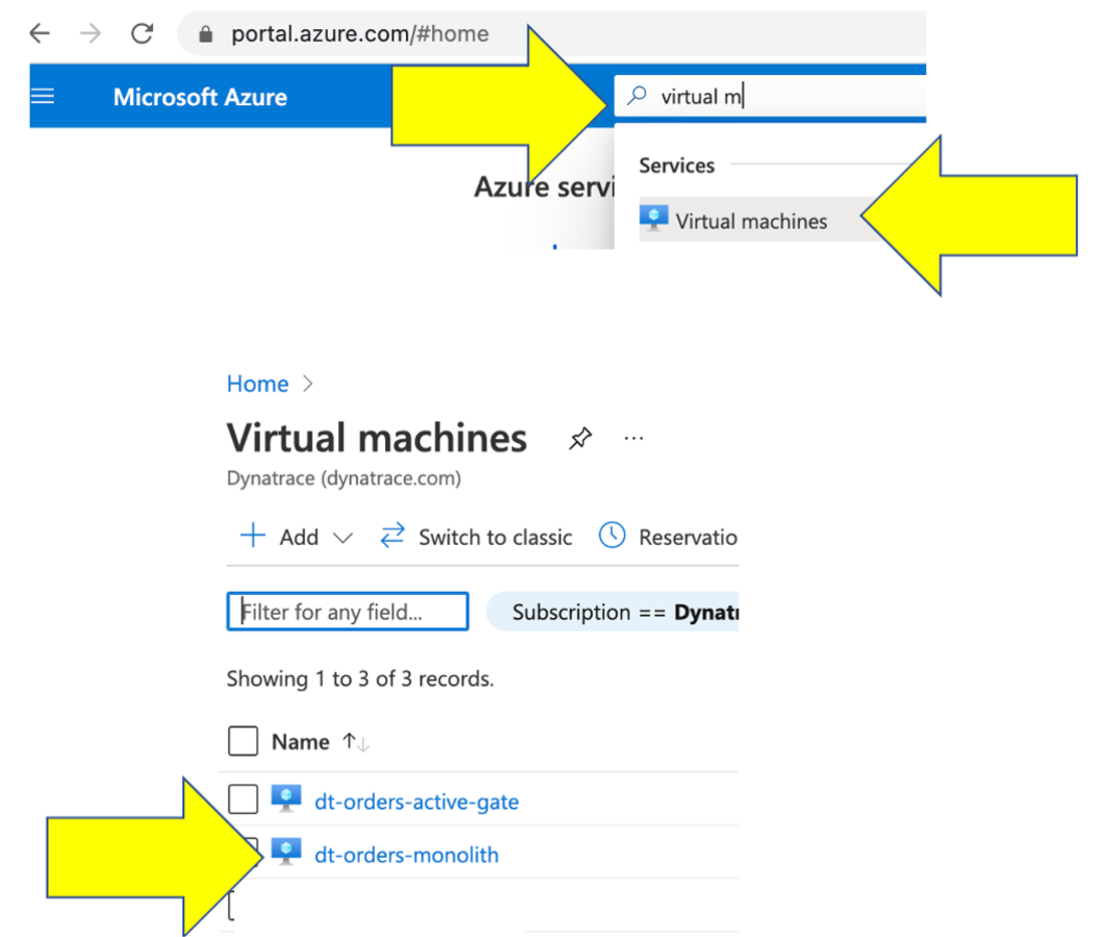
- Once on the Virtual Machine page, click on the VM named
dt-orders-monolith. You can explore details about this VM, but you will want to copy the public IP as shown below.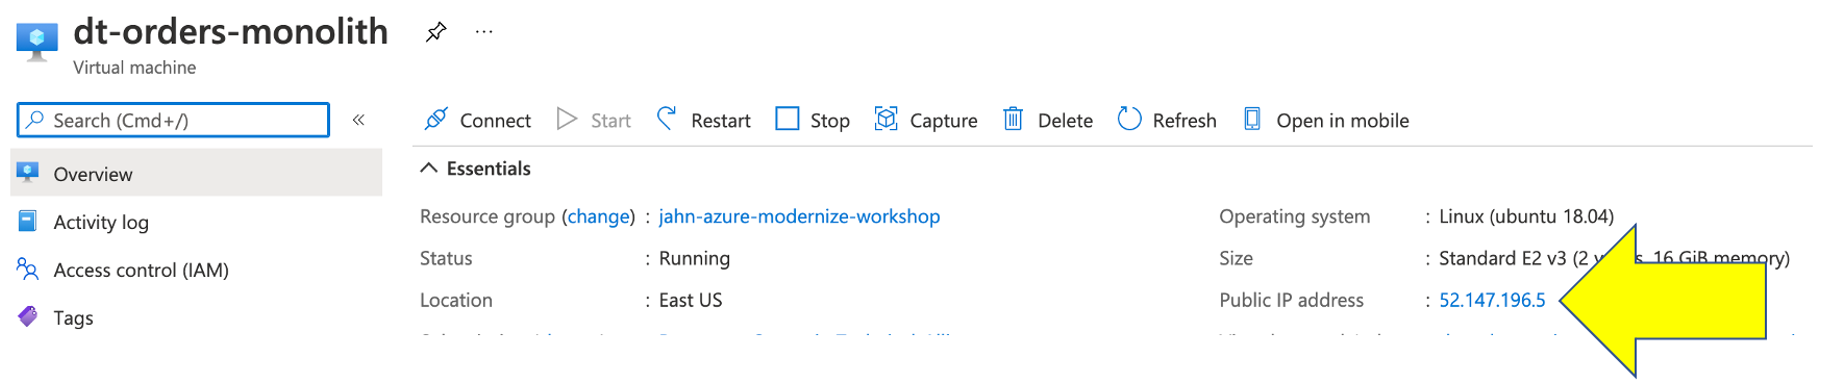
- Open up the Azure Portal and navigate to the Virtual Machine page. You can use the search feature as shown below.
- Navigate the Sample app in a Browser
- To view the application, copy the public IP into a browser. It will look like this:
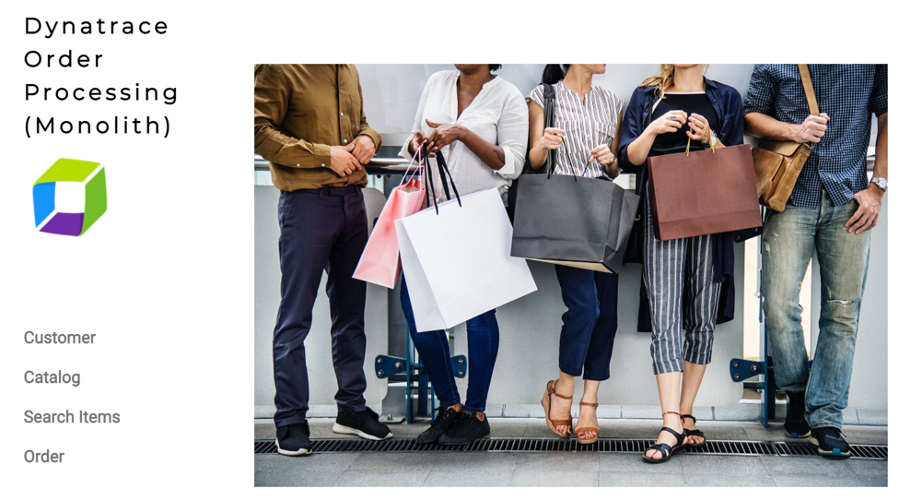
- Use the menu on the home page to navigate around the application and notice the URL for key functionality. You will see these URLs later as we analyze the application.
- Customer List =
customer/list.html - Customer Detail - Each customer has a unique page =
customer/5.html - Catalog List =
catalog/list.html - Catalog Search Form =
catalog/searchForm.html - Order List =
order/list.html - Order Form =
order/form.html
- Customer List =
- To view the application, copy the public IP into a browser. It will look like this:
In this section, you will review what the OneAgent automatically discovered for the host, services, processes, and the complete dependency mapping for the sample application using the new Infrastructure & Operations app now available on Grail.
Tasks to complete this step
- From the left menu, Choose the
Apps -> Infrastructure & Operationsapps. - On the initial view, you'll see two views one by Datacenters and the other by Hosts.
- Under the datacenters view you will see the Azure region your VM's are currently deployed in
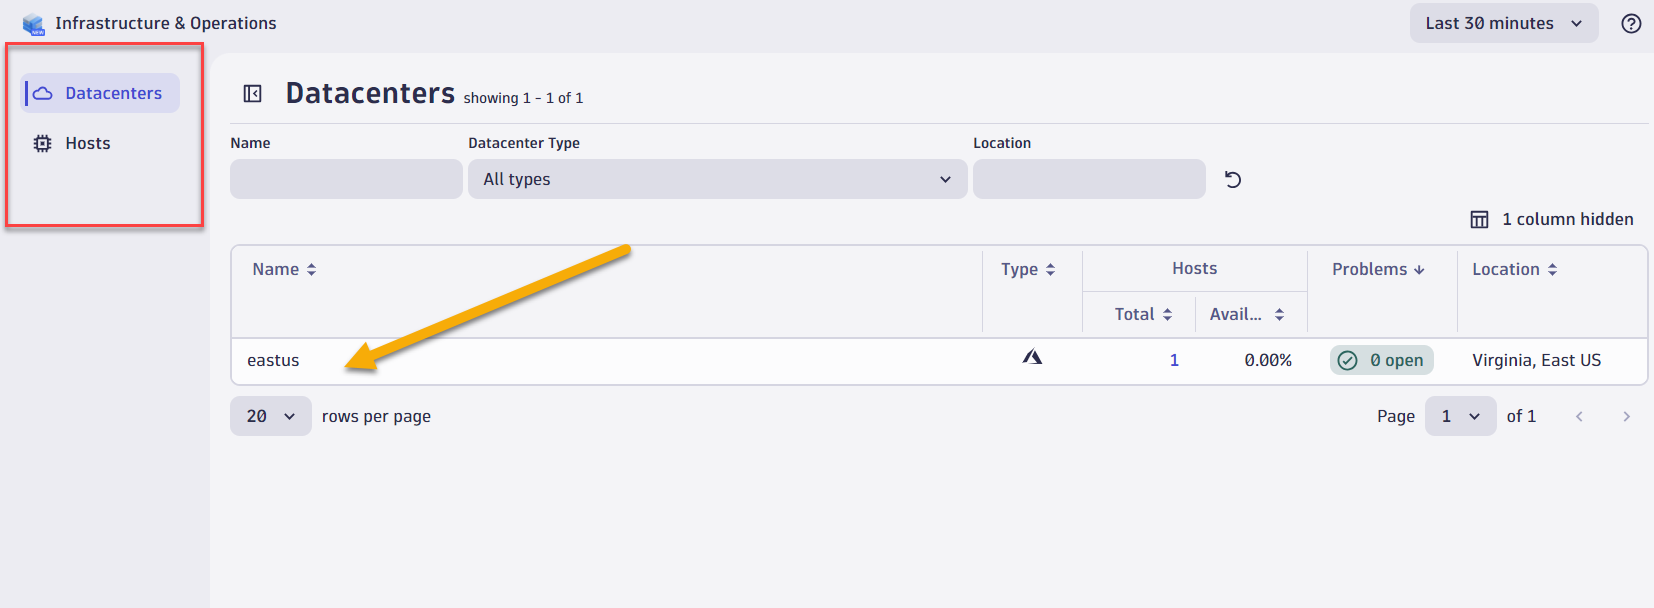
- Under the datacenters view you will see the Azure region your VM's are currently deployed in
- Click hosts view and select the
dt-orders-monolithVM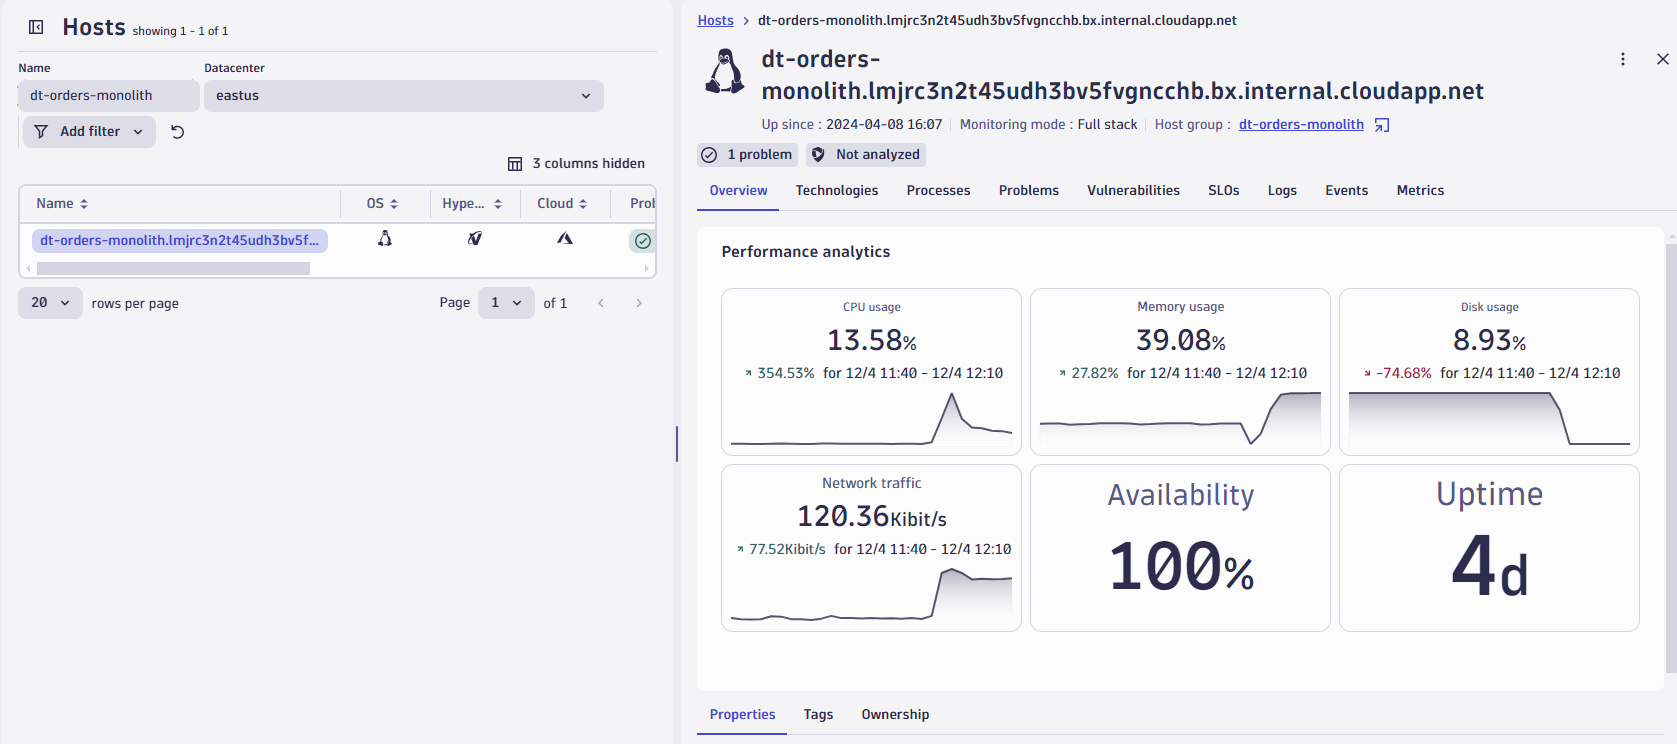
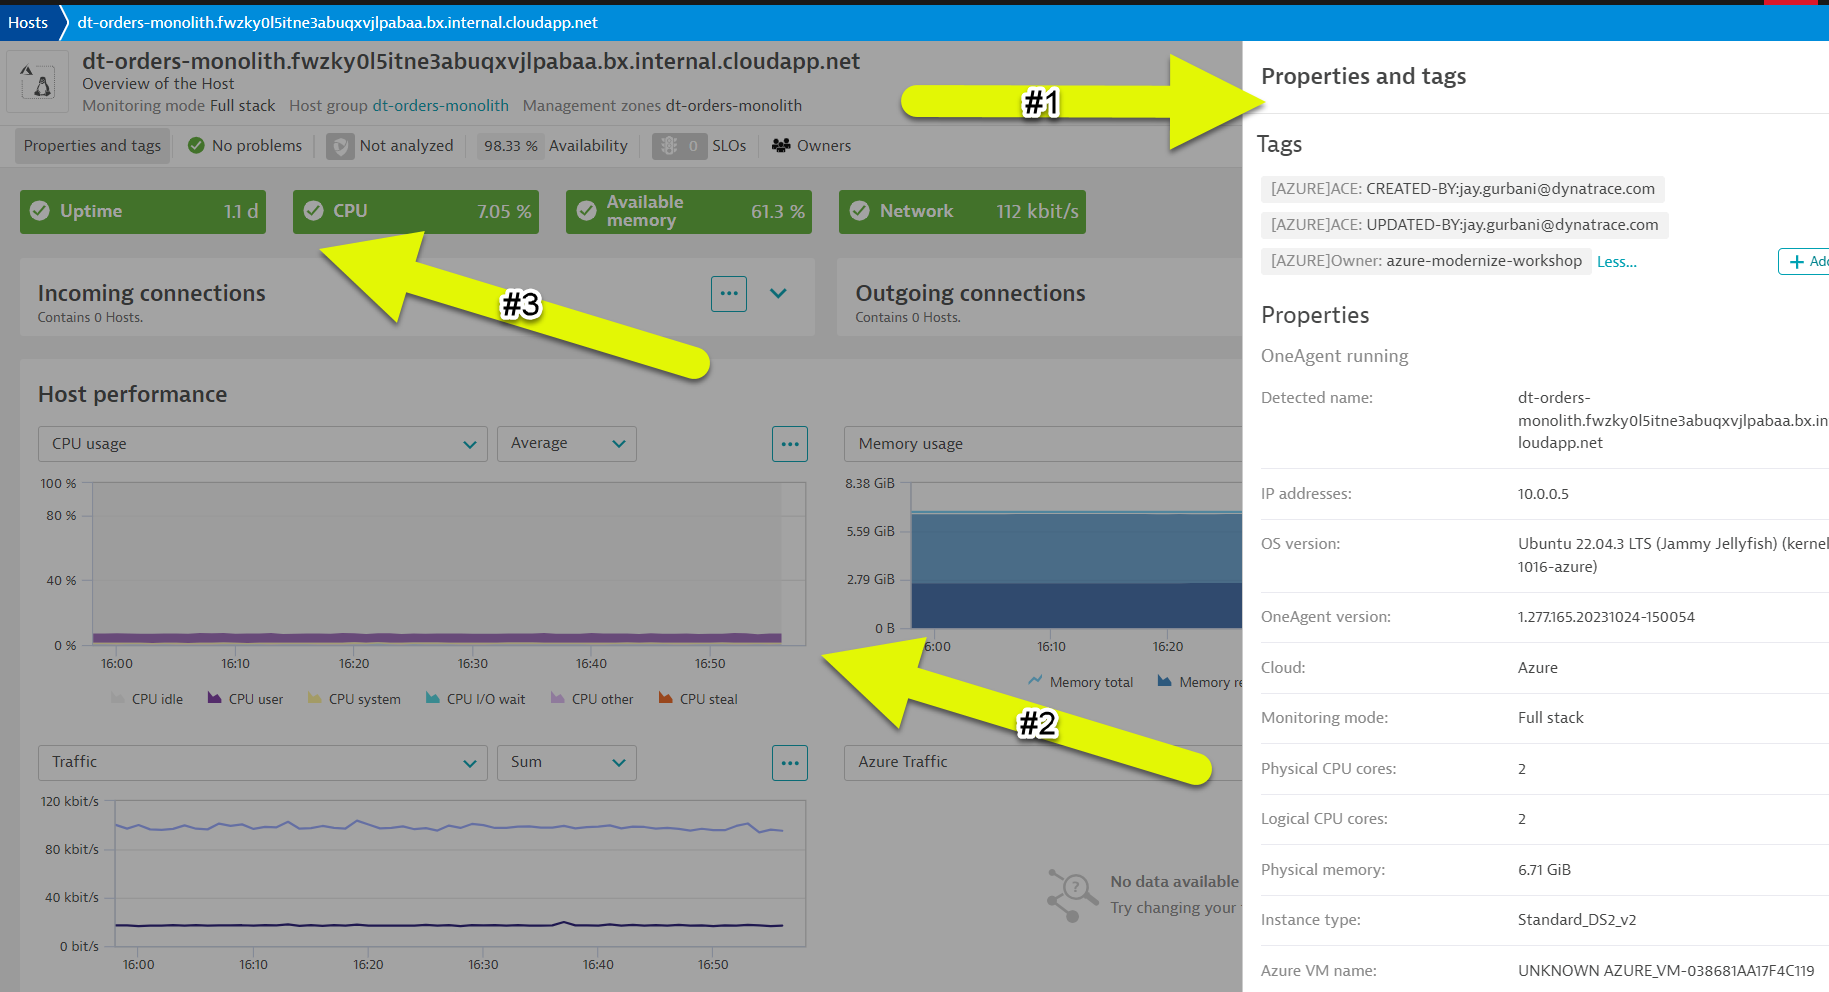
- On the Overview tab, you will notice high level cpu, memory, disk usage, etc metrics for the host. At the bottom you'll see properties, tags and ownership data related to this host.
In the next few sections, you will review what the OneAgent automatically discovered for the host, services, processes, and the complete dependency mapping for the sample application.
Tasks to complete this step
Review the Data on the Hosts screen
- From the left menu, Choose the
Apps -> Hosts Classicapps. Then click on the host with the namedt-orders-monolith.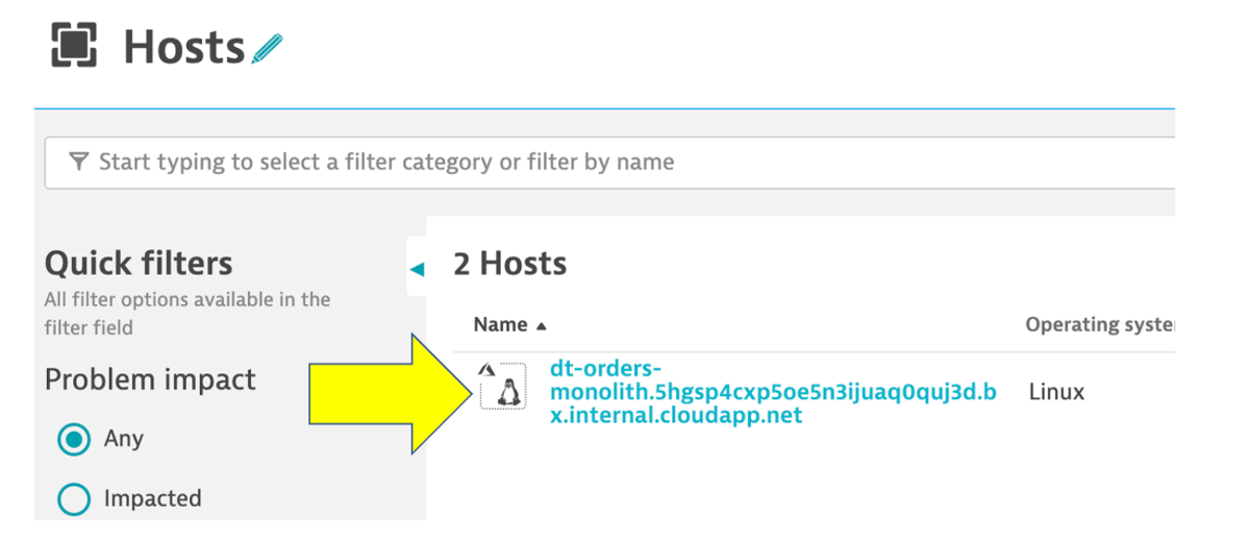
- On host page, you will see basic infrastructure information for the host.
- Now expand the
Propertiessection to see data about the host: - Host resource metrics (CPU, memory)
- Host availability
- Discovered processes. In this case the front end is running Node.js and the backend is running Java in Apache Tomcat. JMeter is running in Java providing the automated user interactions
- Now expand the
Enterprises have many hosts, services, and application that are ever changing. The ability to automatically discover and change as the environment changes is a key feature that Smartscape delivers.
Dynatrace's near real-time environment-topology visualization tool, Smartscape, is where Dynatrace's auto-discovery is delivered into a quick and efficient visualization of all the topological dependencies in your infrastructure, processes, and services.
Tasks to complete this step
Review the data on the Smartscape screen
- Let's see how Dynatrace can visualize these processes using Smartscape.
- Be sure you are on the
dt-orders-monolithhost page - Just click on the
...box on the to the right of the host name - pick
Smartscape viewmenu option - this will open Smartscape filtered to this Host Instance
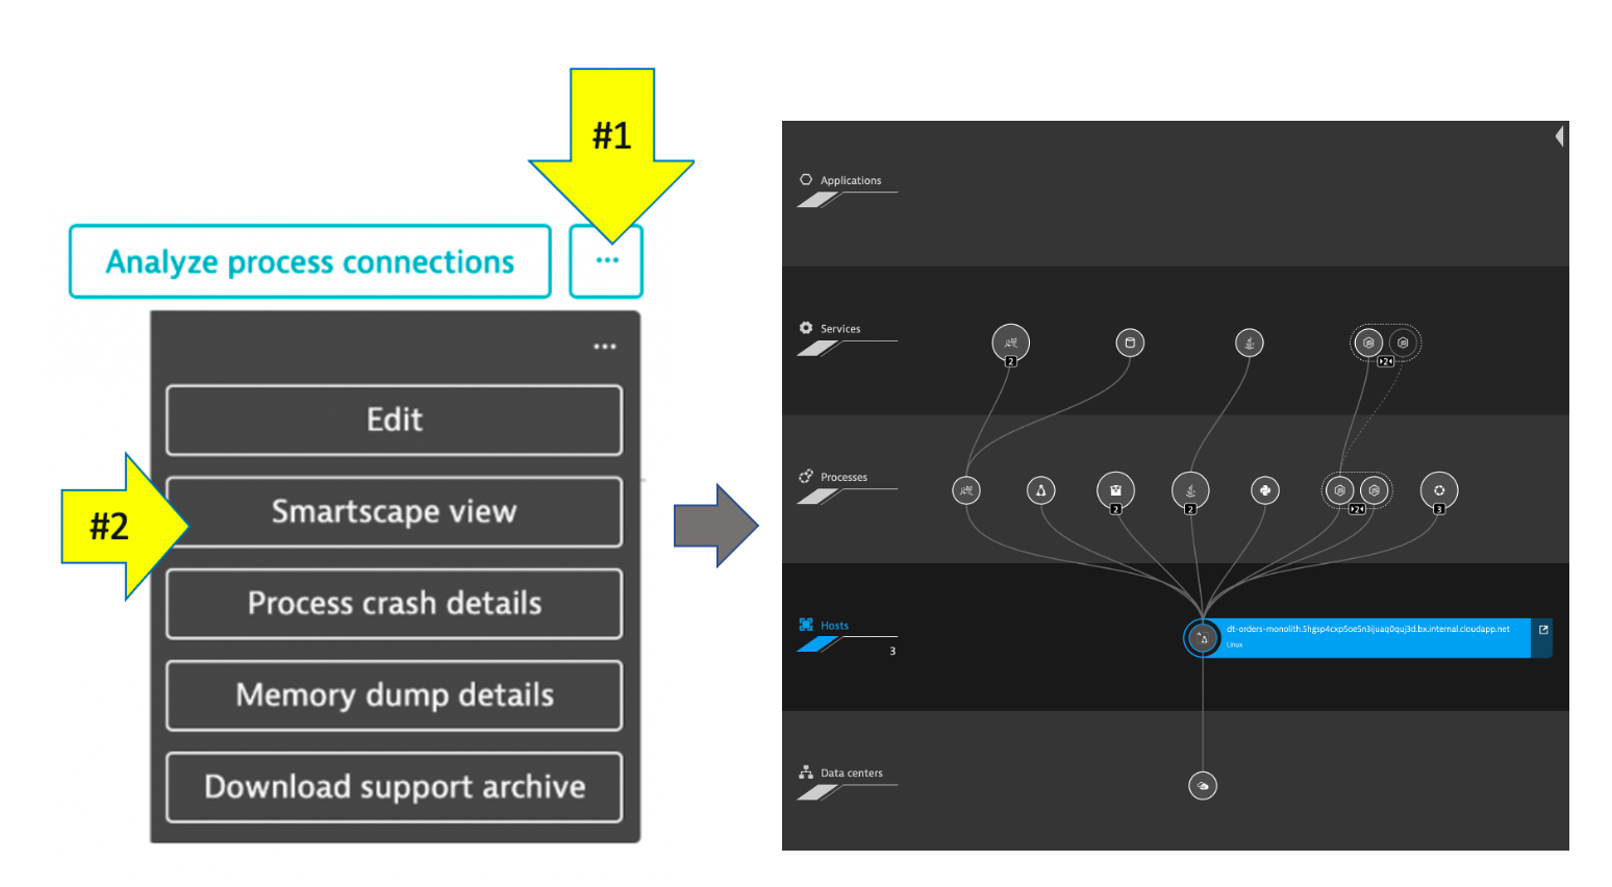
- Be sure you are on the
- Feel free to explore the Smartscape.
In the Smartscape view, we saw the visualizations of the relationships in vertical stack and as well as the relationships spatially. Now let's view the processes and services running on the host.
As you plan your migration, you need more than just host level metrics. Knowing the details for each service, BEFORE you change it, will lower the risk of impacting the business.
Tasks to complete this step
- Review the data on the Process screen
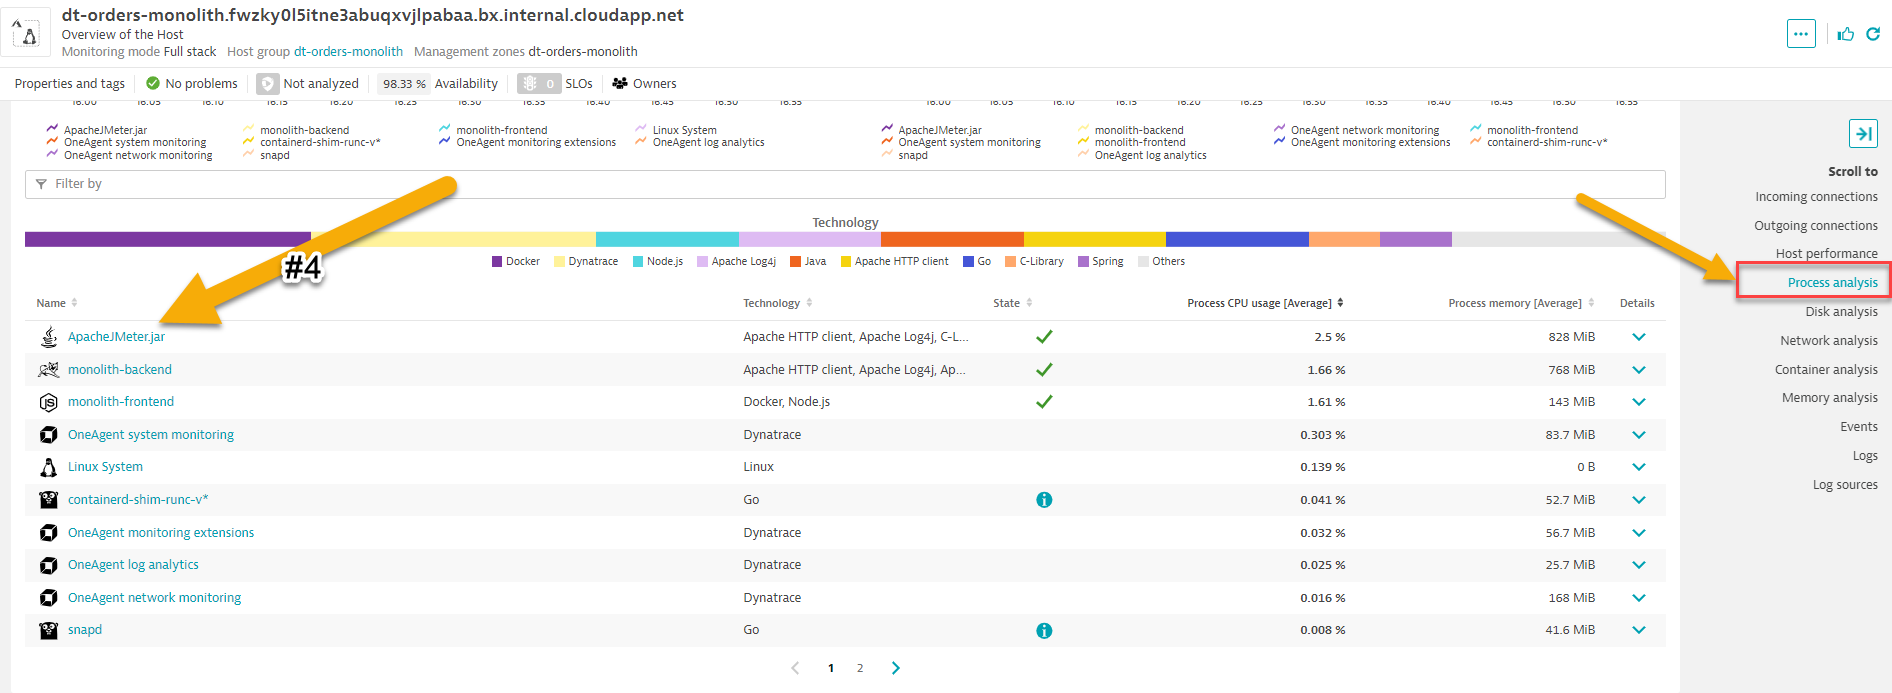
- Return back to the host view for the host with the prefix of
dt-orders-monolithand locate theProcesses Analysissection on far right hand side of the screen. - Click on the 2nd
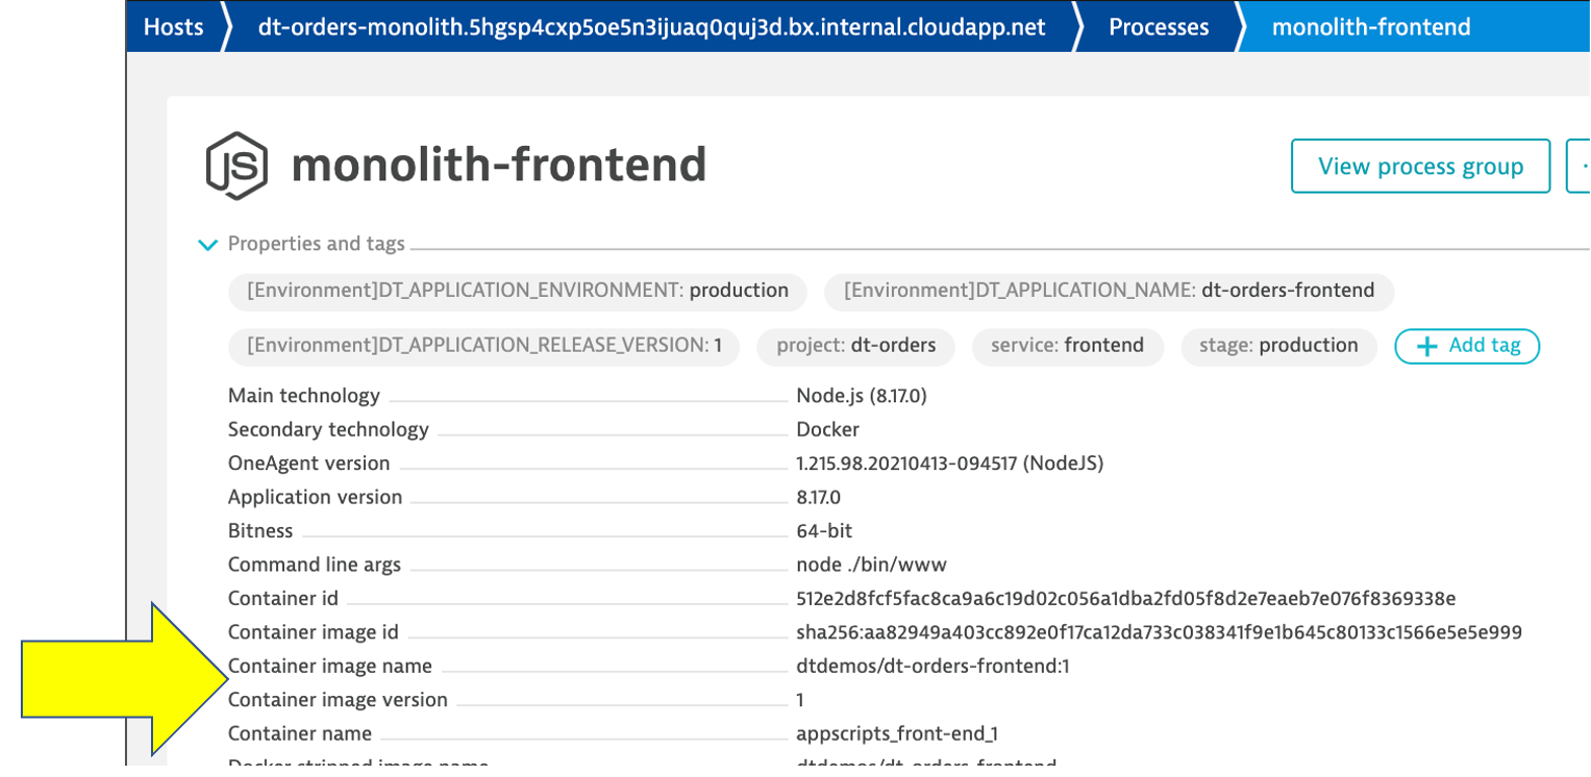
monolith-frontendprocess to open the process detail view. - You should be on the process page where you will see information for this process. Follow the picture below to locate the following:
- Click on the
Properties and tagsline to toggle on/off to see additional data - Notice the properties such as open ports
- On the info graphic:
- Click to view the processes that call this process (Inbound)
- Click to view the services that are served by this process. In this case there are multiple
- Click to view the processes that this process calls (Outbound)
- Click to view the Process specific metrics
- Did you notice Docker??
- Click on the
- Return back to the host view for the host with the prefix of
- Review the data on the Services screen
- Now Let's review a specific service.
- Click the
servicessquare above the host infographic to open the list of services - From the list of services, choose the
frontend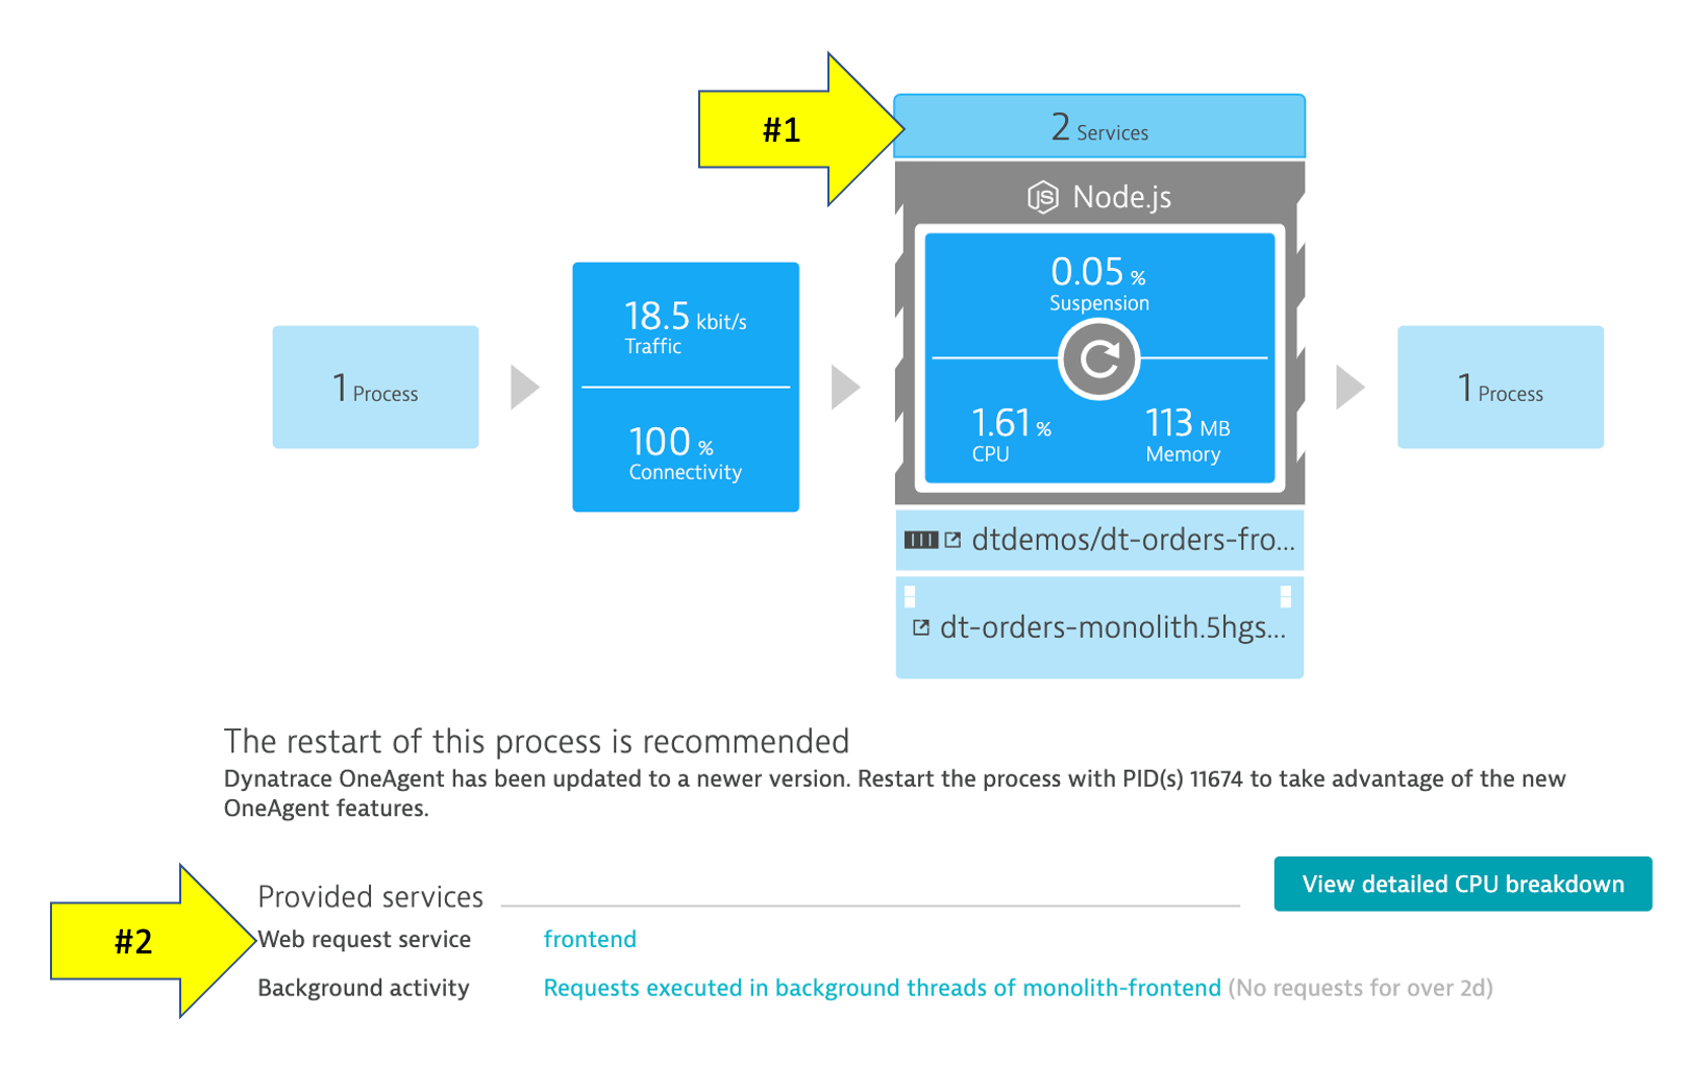
- Click the
- You should be on the service page where you will see information for this specific service. Follow the picture below to locate the following:
- Click on the
Propertiesline to toggle on/off to see additional data - Click to view the services that call this service (Inbound)
- Click to view the services that this service calls (Outbound)
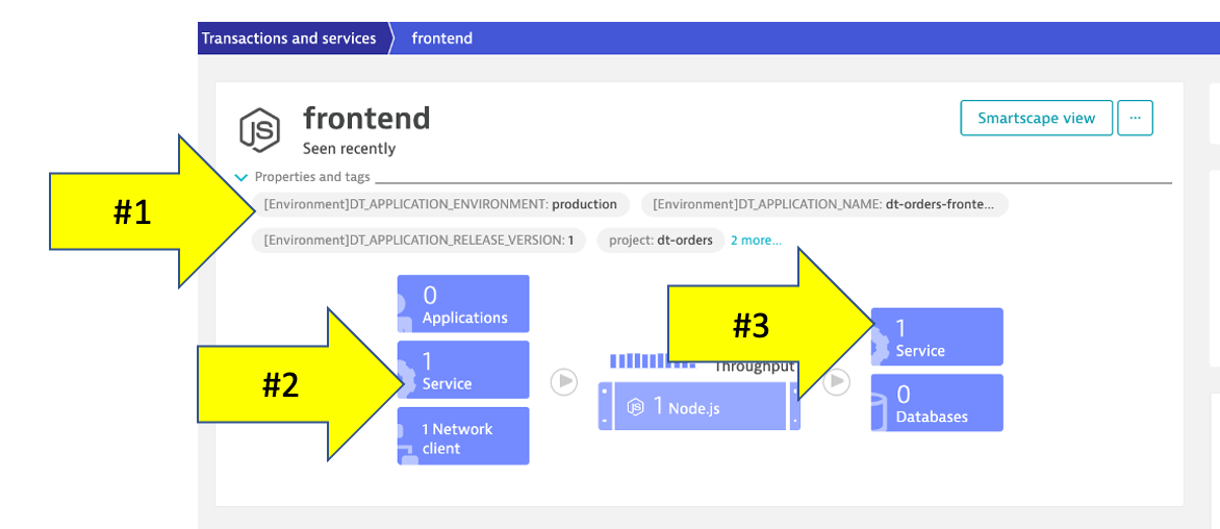
- Click on the
- Now Let's review a specific service.
Web applications consist of web pages that are served by web servers and web application processes, for example Tomcat. Web and mobile applications are built upon services that process requests like web requests, web service calls, and messaging.
Such "server-side services" can take the form of web services, web containers, database requests, custom services, and more. Services may in turn call other services such as web services, remote services, and databases services.
Tasks to complete this step
- Review the Services being monitored. Let's now take a look at all the services being monitored by selecting
ServicesApp from the left side Dynatrace menu.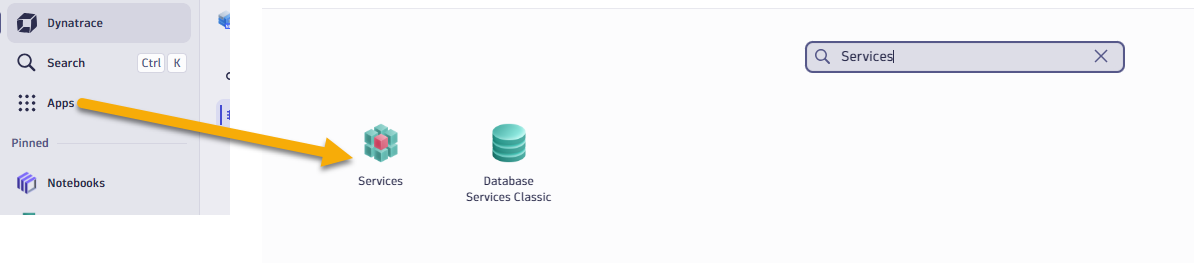
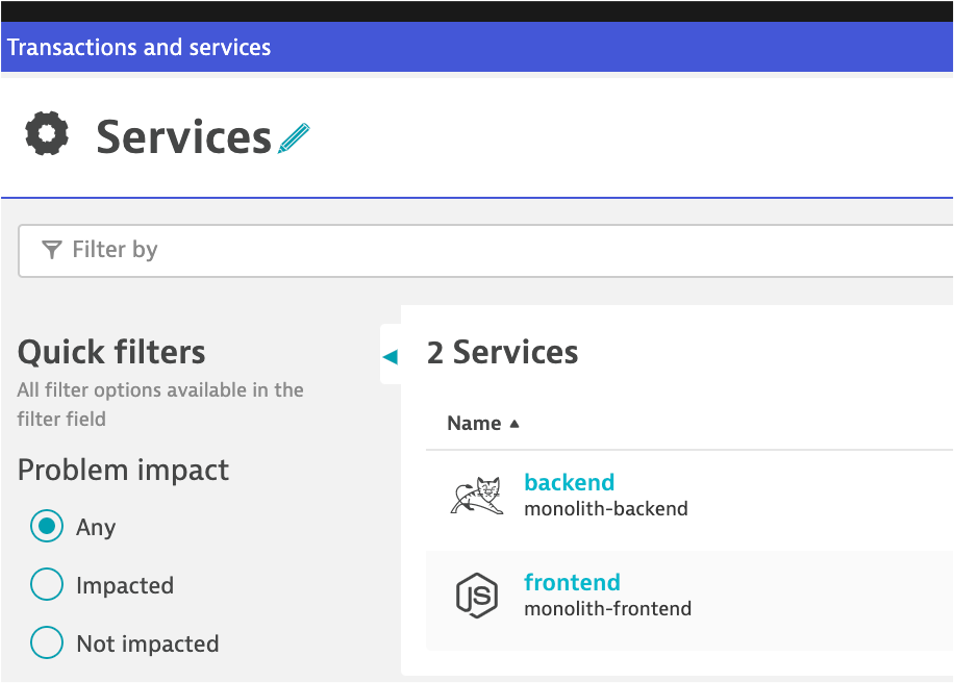
- The services list should now look like this:
- Choose the
frontendservice. - On the
frontendservice page, find theKey Requests/endpointssection on the right and click theTop web Requestsbutton to see what it calls.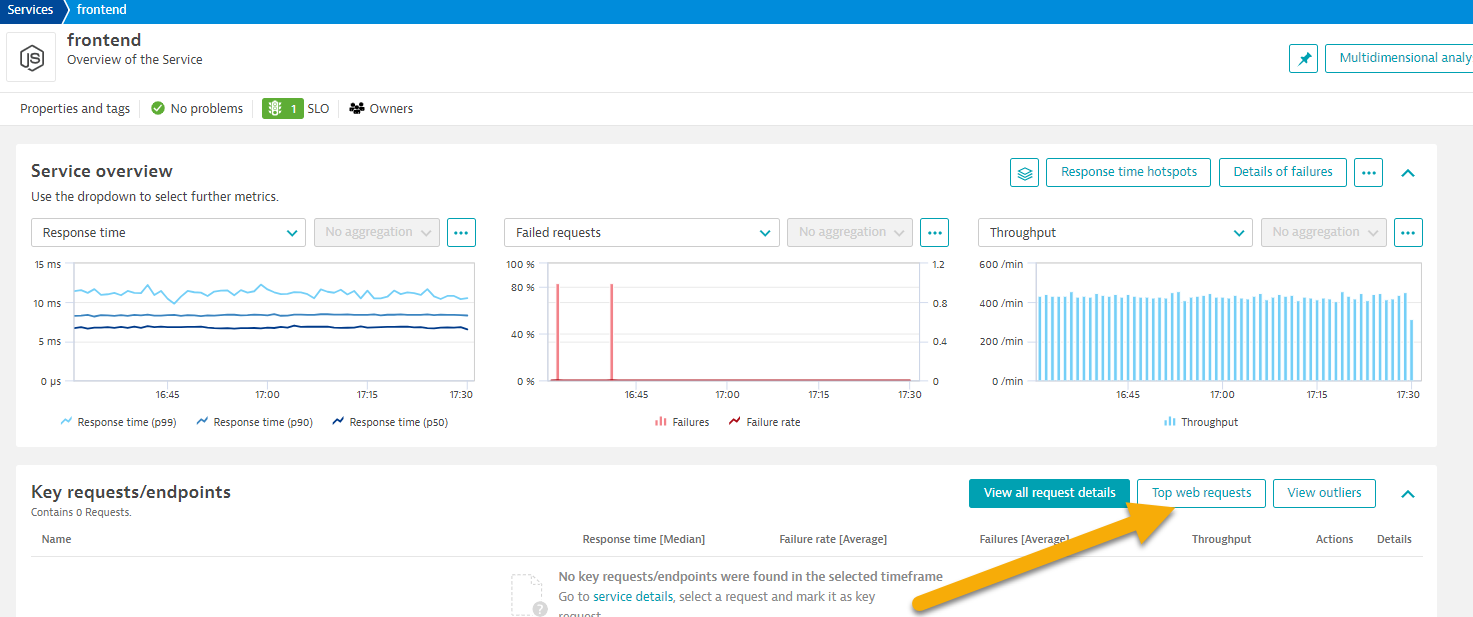
- On this page you can view the transactions as time-series charts.
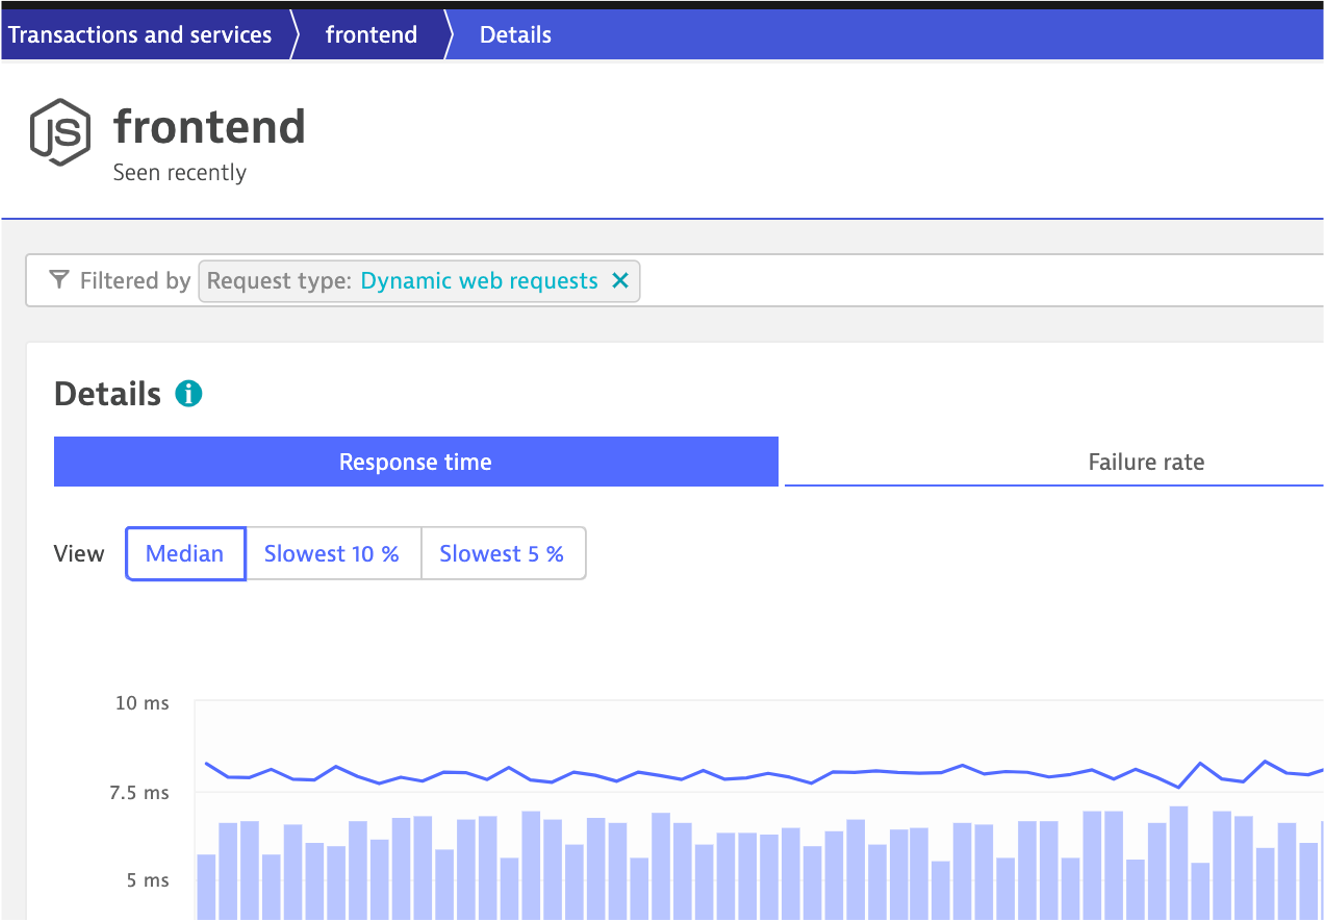
- On this page you can view the top web requests by count. You should recognize the URLs from the sample app!
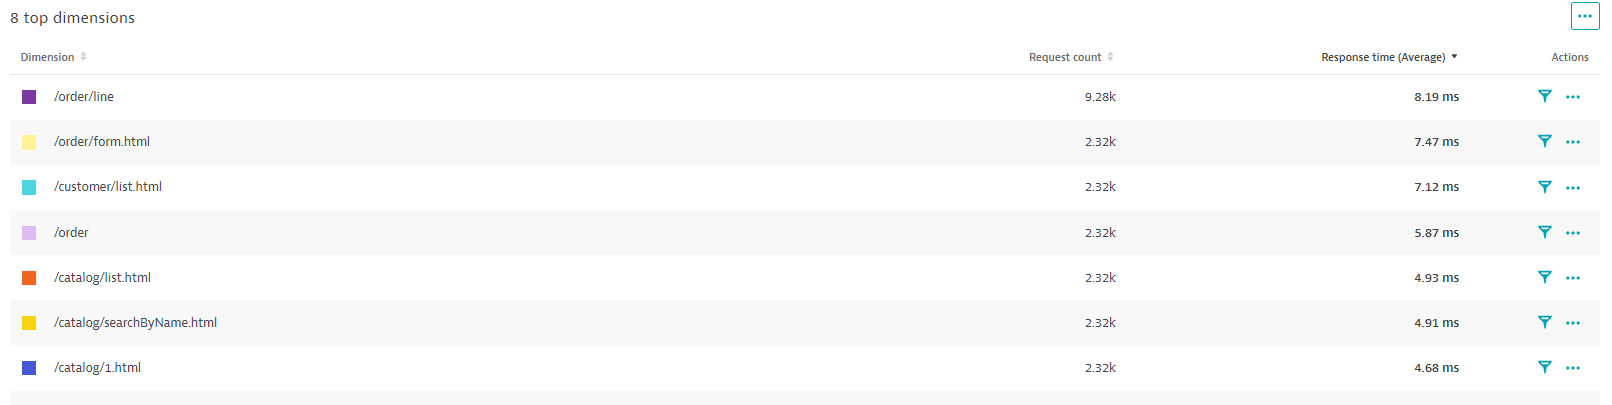
- You can also view top web request by Response Time by simply changing the metric to Response Time By clicking on one of the requests.
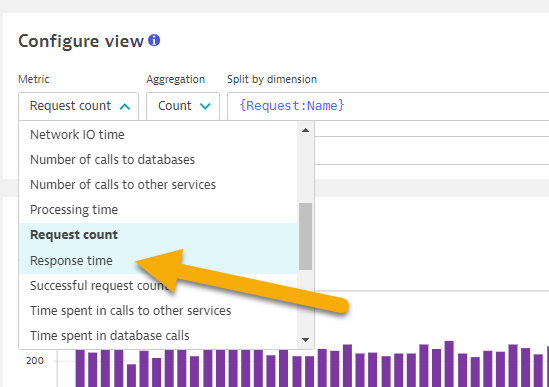
- On this page you can view the transactions as time-series charts.
- The services list should now look like this:
We just saw one way to review process and service communication, but let's look at how Dynatrace understands your applications' transactions from end to end and visualizes through Service Backtraces and Service flows.
- With
Service flow, you see the flow of service calls FROM a service, request, or their filtered subset. Along with the specific services that are triggered, you can also see how each component of a request contributes to the overall response time. - With
Service backtrace, you see the calls TO a service.
Tasks to complete this step
- Review the Service Flow
- Return to the
frontendservice. You can use thebreakcrumbmenu as shown below.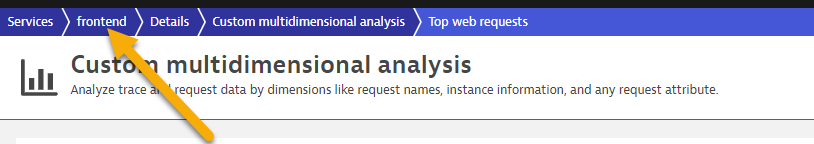
- On the
frontendservice page, locate theTopologysection on the right, and then click theService Flowbutton.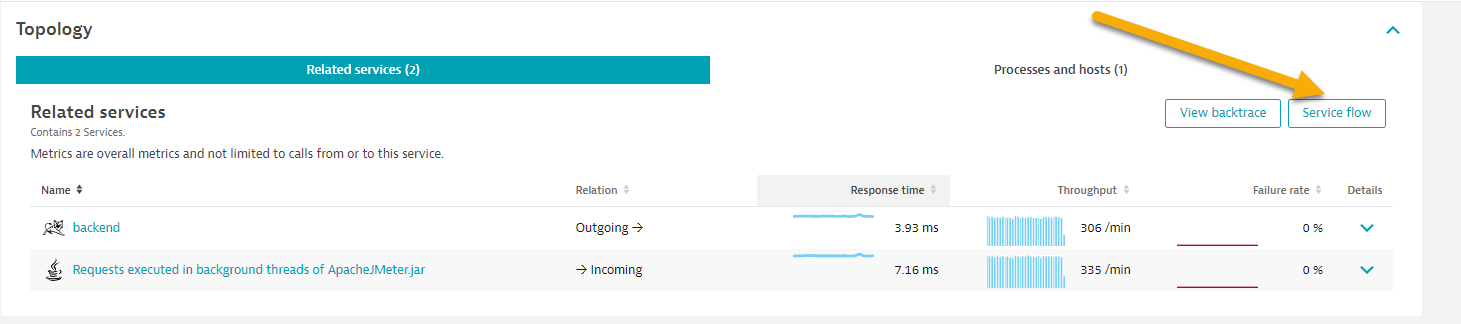
- Return to the
- Response time perspective
- You should now be on the Service flow page.
- Right away, we can see how this application is structured:
- Frontend calls backend
- Backend calls database
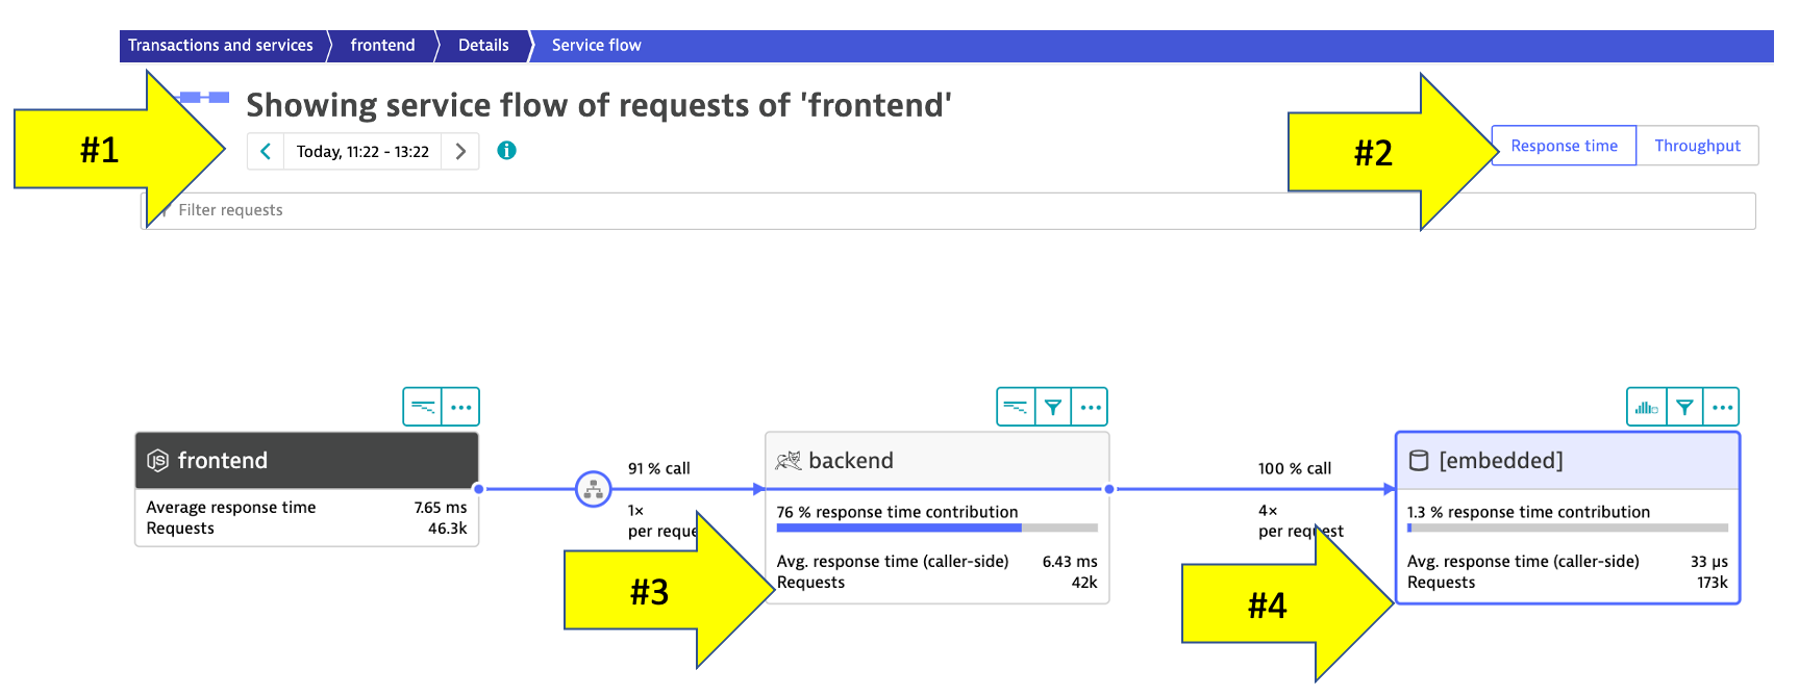
- Refer to the numbers in the picture above:
- The timeframe defaults to 10 minutes but can be adjusted.
- We are viewing the data from a Response time perspective. Shortly, we will review the Throughput perspective.
- Click on the boxes to expand the response time metrics. We can see that most of the time is spent in the backend service.
- Even though there are a few calls to the database for every backend service request, only a very small amount of the response time is spent in the database.
- Throughput perspective
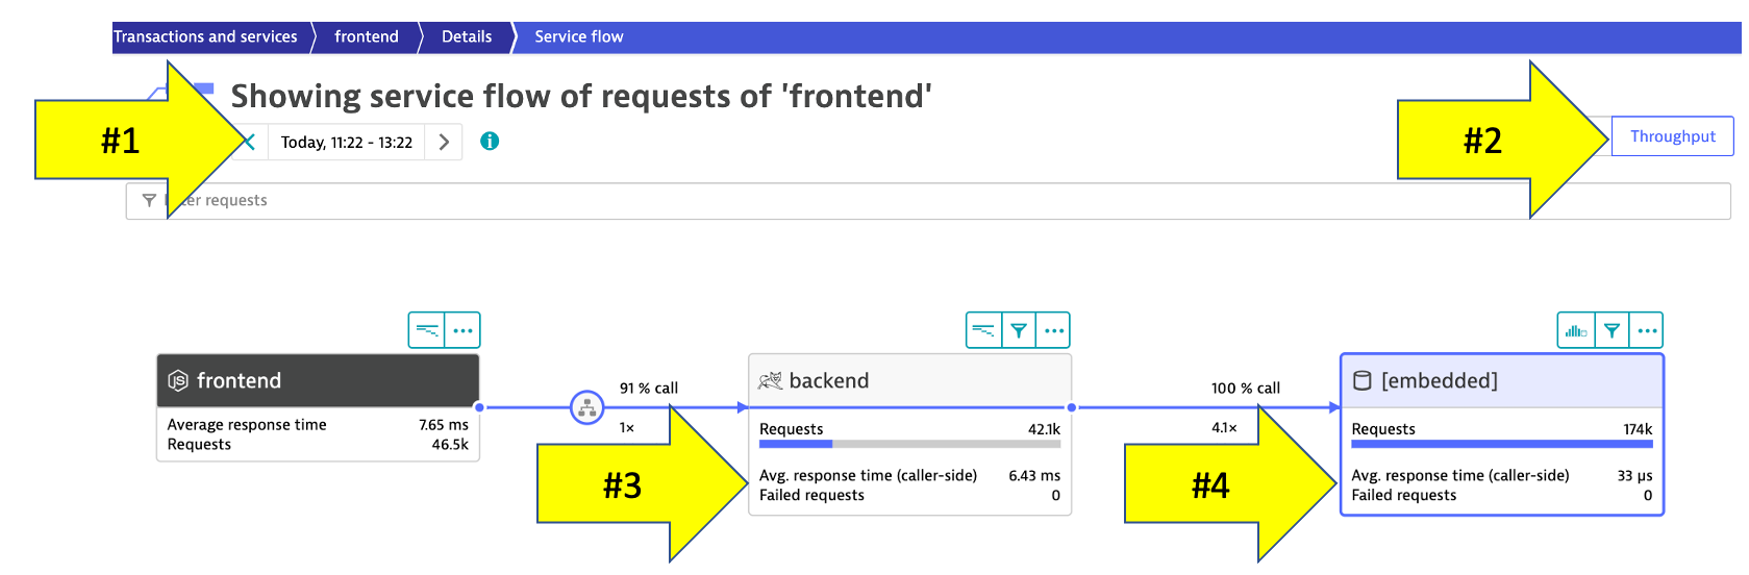
- Refer to the numbers in the picture above:
- The timeframe defaults to 10 minutes but can be adjusted
- Change to the Throughput perspective by clicking on the box
- Click on the boxes to expand the metrics to see the number of requests and average response times going to the backend sevice
- We can see the number of requests to
backenddatabase
- Refer to the numbers in the picture above:
As you plan your migration, Database observability is critical to a successful plan. Knowing the type of access, executed statements, and amount of data transferred during regular hours of operation allows for better migration planning and prioritization of the move groups. In some cases, you may decide to not migrate this database in favor of other services or databases that are less complex to migrate due to fewer dependencies.
Tasks to complete this step
- Navigate to the Database screen
- Lets get back to the
backendservice. One way is to go back to theServicesleft side Dynatrace menu and then pick thebackendservice for thedt-orders-monolithmanagement zone. - On the
backendservice page, click on the[embedded]database under theTopologysection to open the database service page.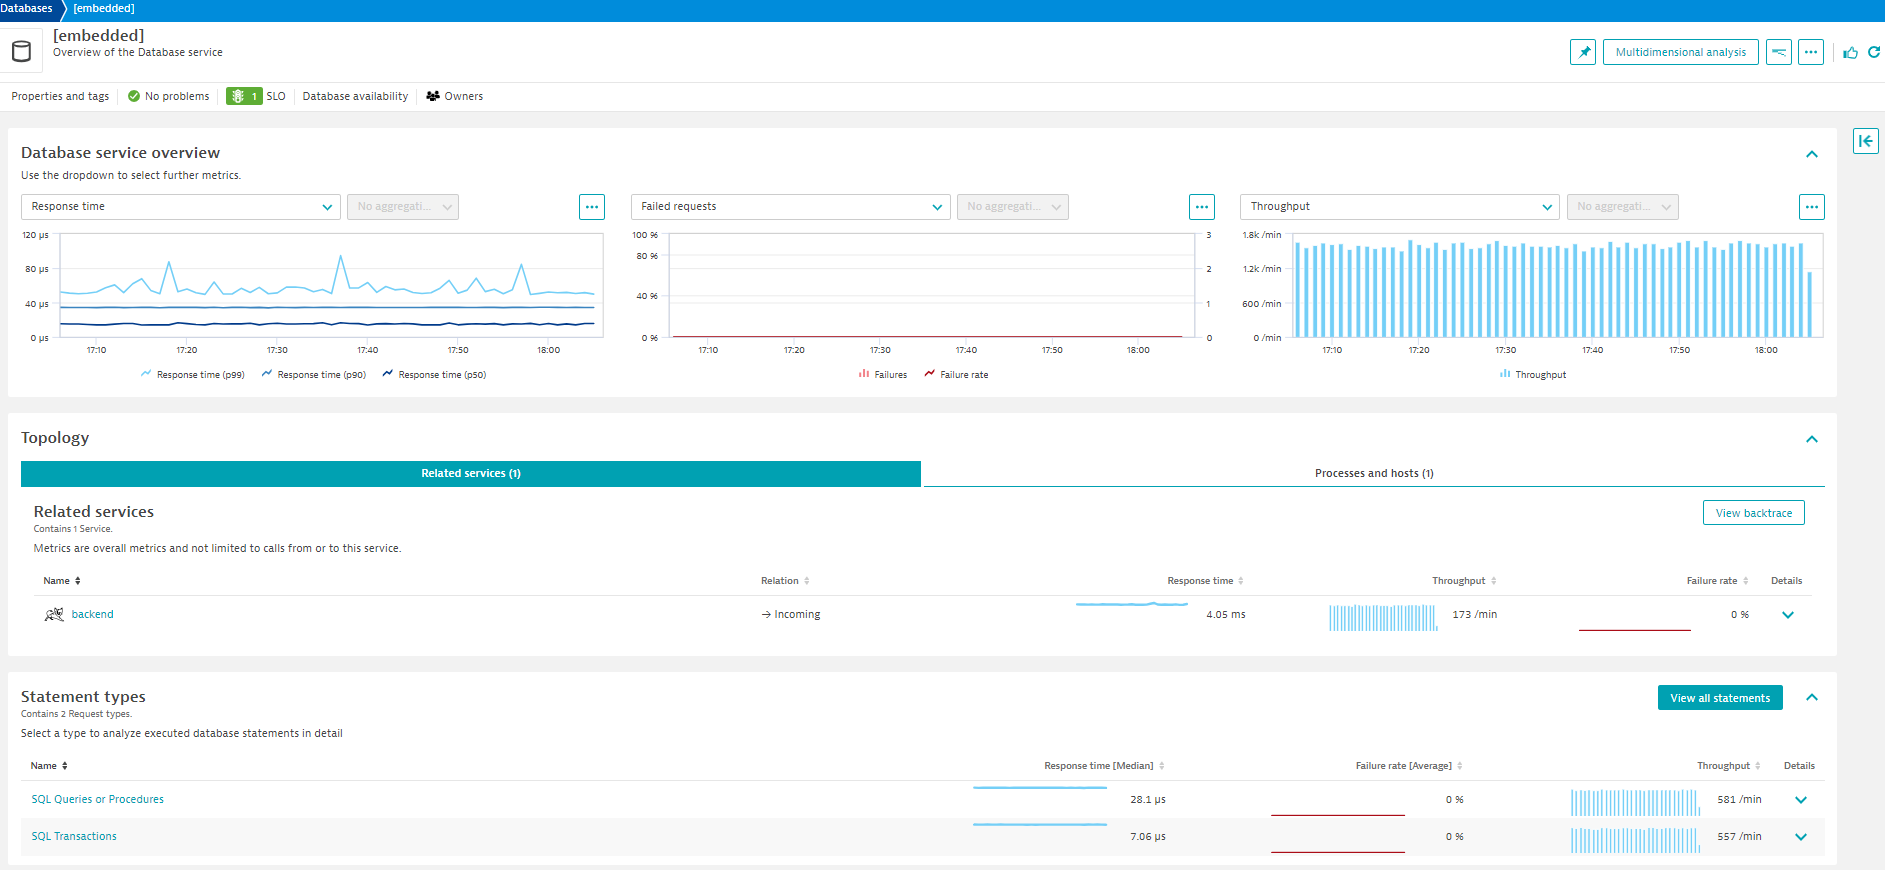
- Lets get back to the
- Review the Database screen
- The sample application uses an In memory Java relational database. On this page you can explore the database process like
- What services call this database
- Database availability
- View individual SQL statements
- Various Database metric
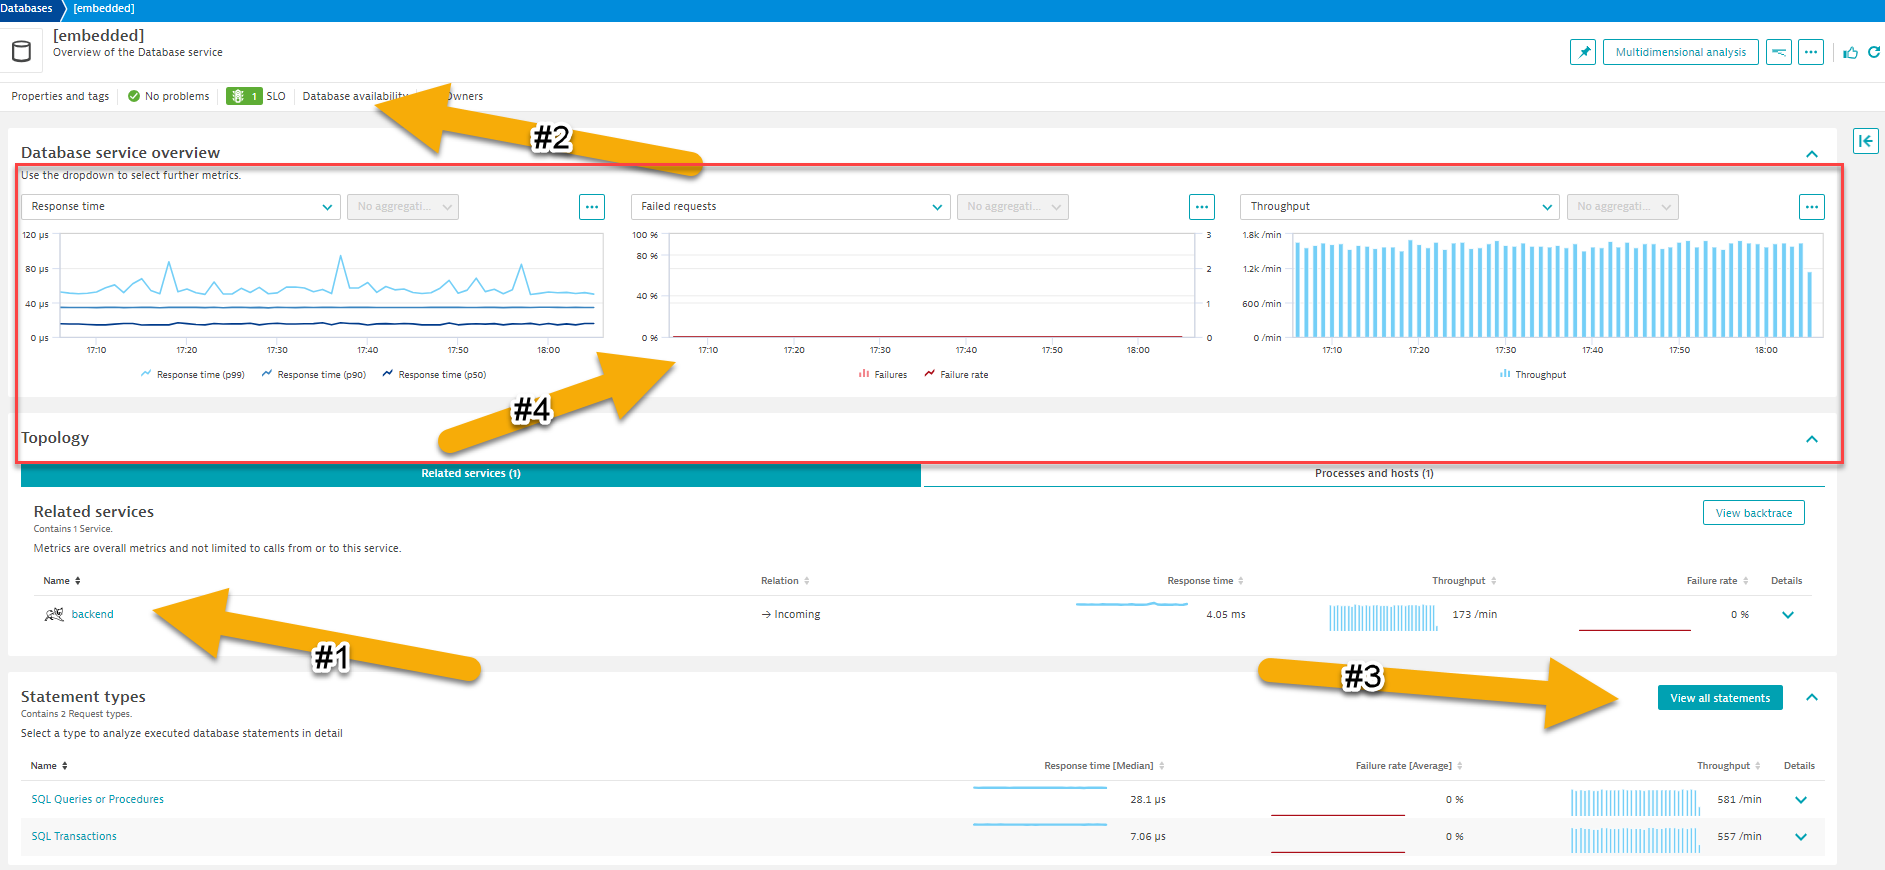
- The sample application uses an In memory Java relational database. On this page you can explore the database process like
By default, Dynatrace gives you FullStack horizontal (who talks to whom) and vertical (what runs on what) dependency visibility as part of Dynatrace Smartscape! All without a single line of code or configuration change – just by installing the OneAgent
Seeing which processes make up the monolith has been an eye-opener for many teams that have done this exercise. "Oh – we completely forgot about the dependency to this legacy process we introduced 5 years ago!" – that's a common thing you hear!
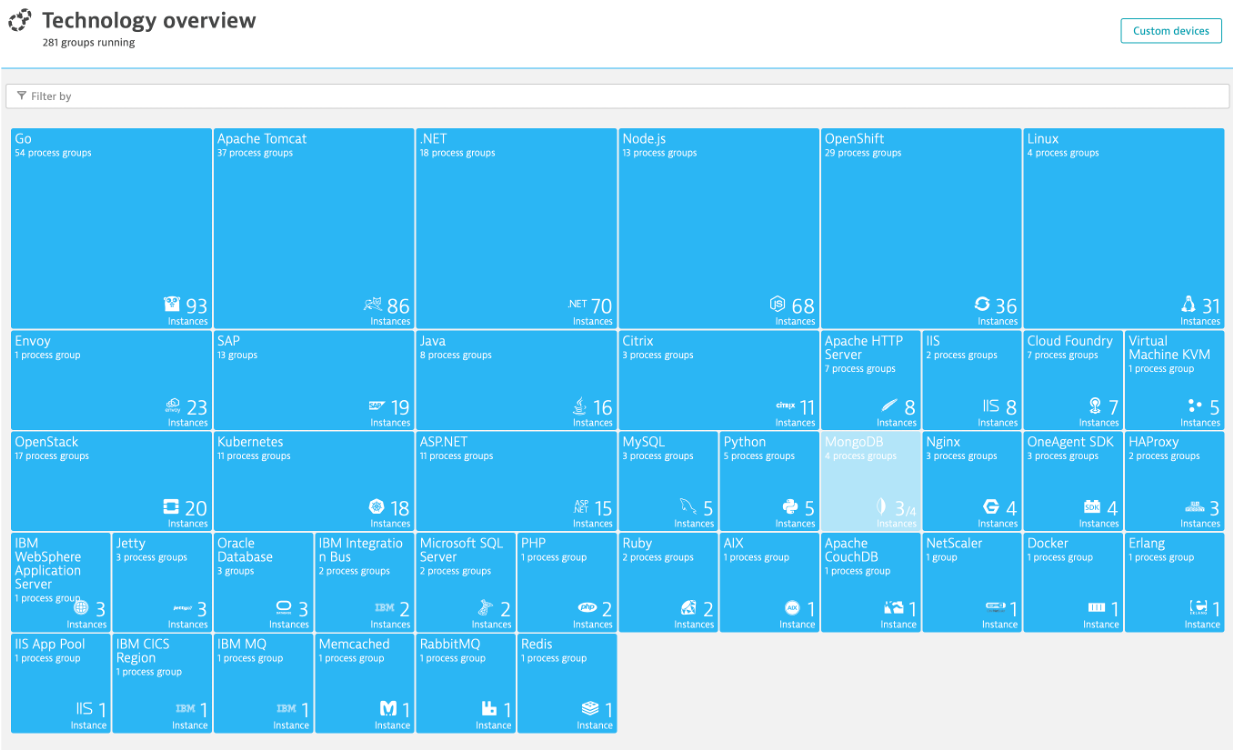
As you plan your migration, knowing what technologies make up your eco-system is key so that you can decide whether to migrate, refactor or replace certain services.
The workshop is somewhat limited, so here is an example from another environment.
Tasks to complete this step
- Review the Technologies view
- Click on the Technology and processes Classic App on the left side menu within Dynatrace to view the technologies that OneAgent was able to automatically discover and instrument.
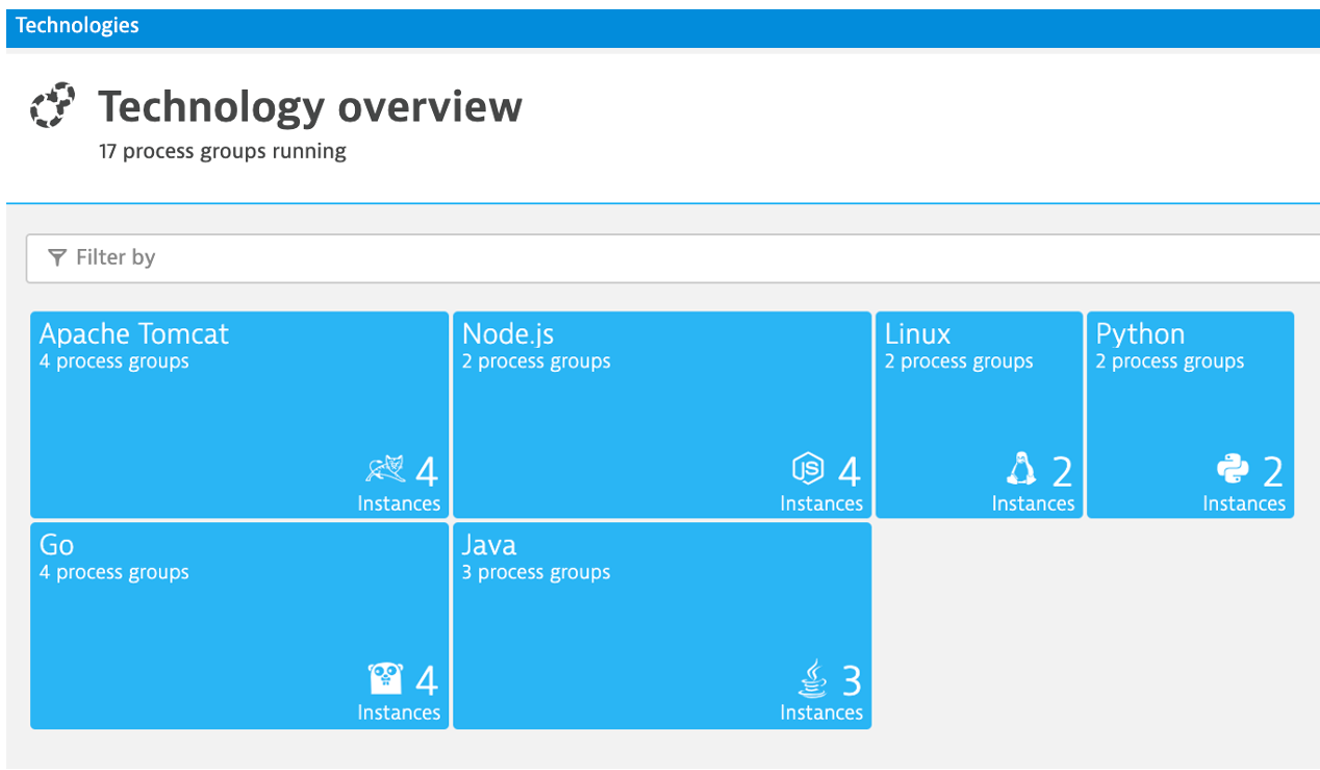
- Make sure your management zone filter is set to
Allso that you see everything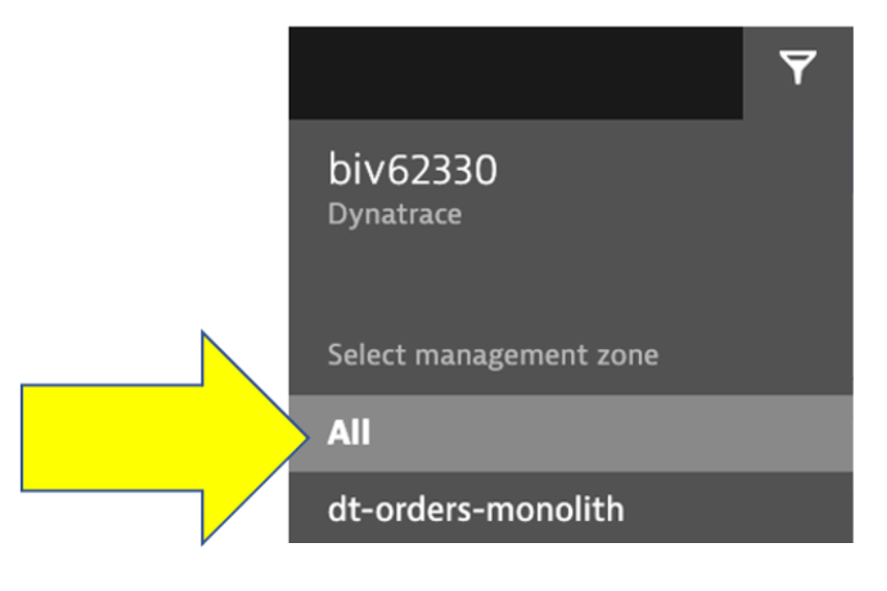
- In the filter box, type
tag, choosestage, and the value ofproduction. It should look like this: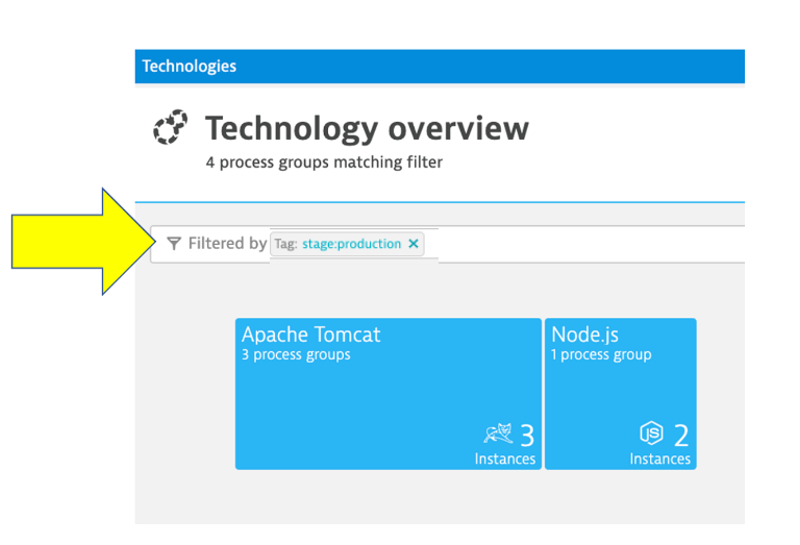
Planning Ahead
You can always click into the Hub menu within Dynatrace to learn about the many technologies that Dynatrace supports. This list is in sync and constantly updated in conjunction with the Dynatrace website hub page
By just installing the OneAgent, we have now gained a detailed topological view of sample application from the both the infrastructure and application tiers and we are now ready to tackle our adoption to the cloud armed with the answers we need.
- Right Priority - We now understand the complexity and interdependency of services and components to the rest of the environment architecture
- Right-Sizing the environment - We now understanding which resources are required to move along with their required resource consumption patterns
- Best Migration Strategy - We now understand the current end-to-end transactions through architecture and can choose the best migration strategy (rehost, refactor, rearchitect, rebuild)
Checklist
In this section, you should have completed the following:
✅ Review Dynatrace OneAgent
✅ Review real-time data now available for the sample application
✅ Review how Dynatrace helps with modernization planning