Re-hosting (also referred to as lift and shift) is a common migration use case. Re-architecture and Re-platform are steps that break the traditional architectures and replace individual components with cloud services and microservices.
We just learned how we can get great information on services, processes and user requests using Dynatrace and OneAgent. This helps us now decide what individual features or complete applications based on business benefits we need to migrate and modernize. The idea here is to focus on feature-based business benefit with functional migration.
Objectives of this Lab
🔷 Install the Dynatrace Operator and sample application
🔷 Review how the sample application went from a simple architecture to multiple services
🔷 Examine the transformed application using service flows and back traces
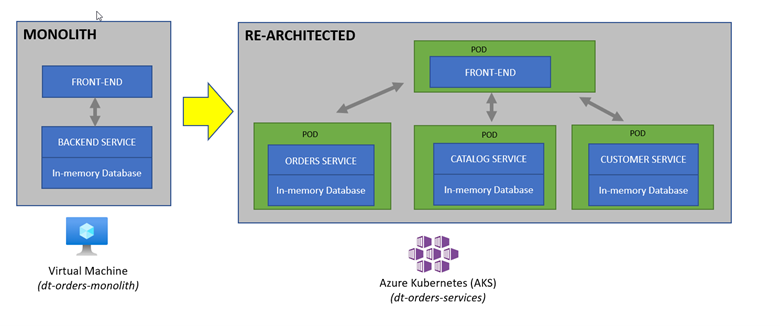
For our lab, another version of the application exists that breaks out each of these backend services into separate services. By putting these services into Docker images, we gain the ability to deploy the service into modern platforms like Azure Kubernetes and Cloud managed services such as the ones from Azure shown below.
The picture below shows how the components of the sample application interact with Dynatrace.
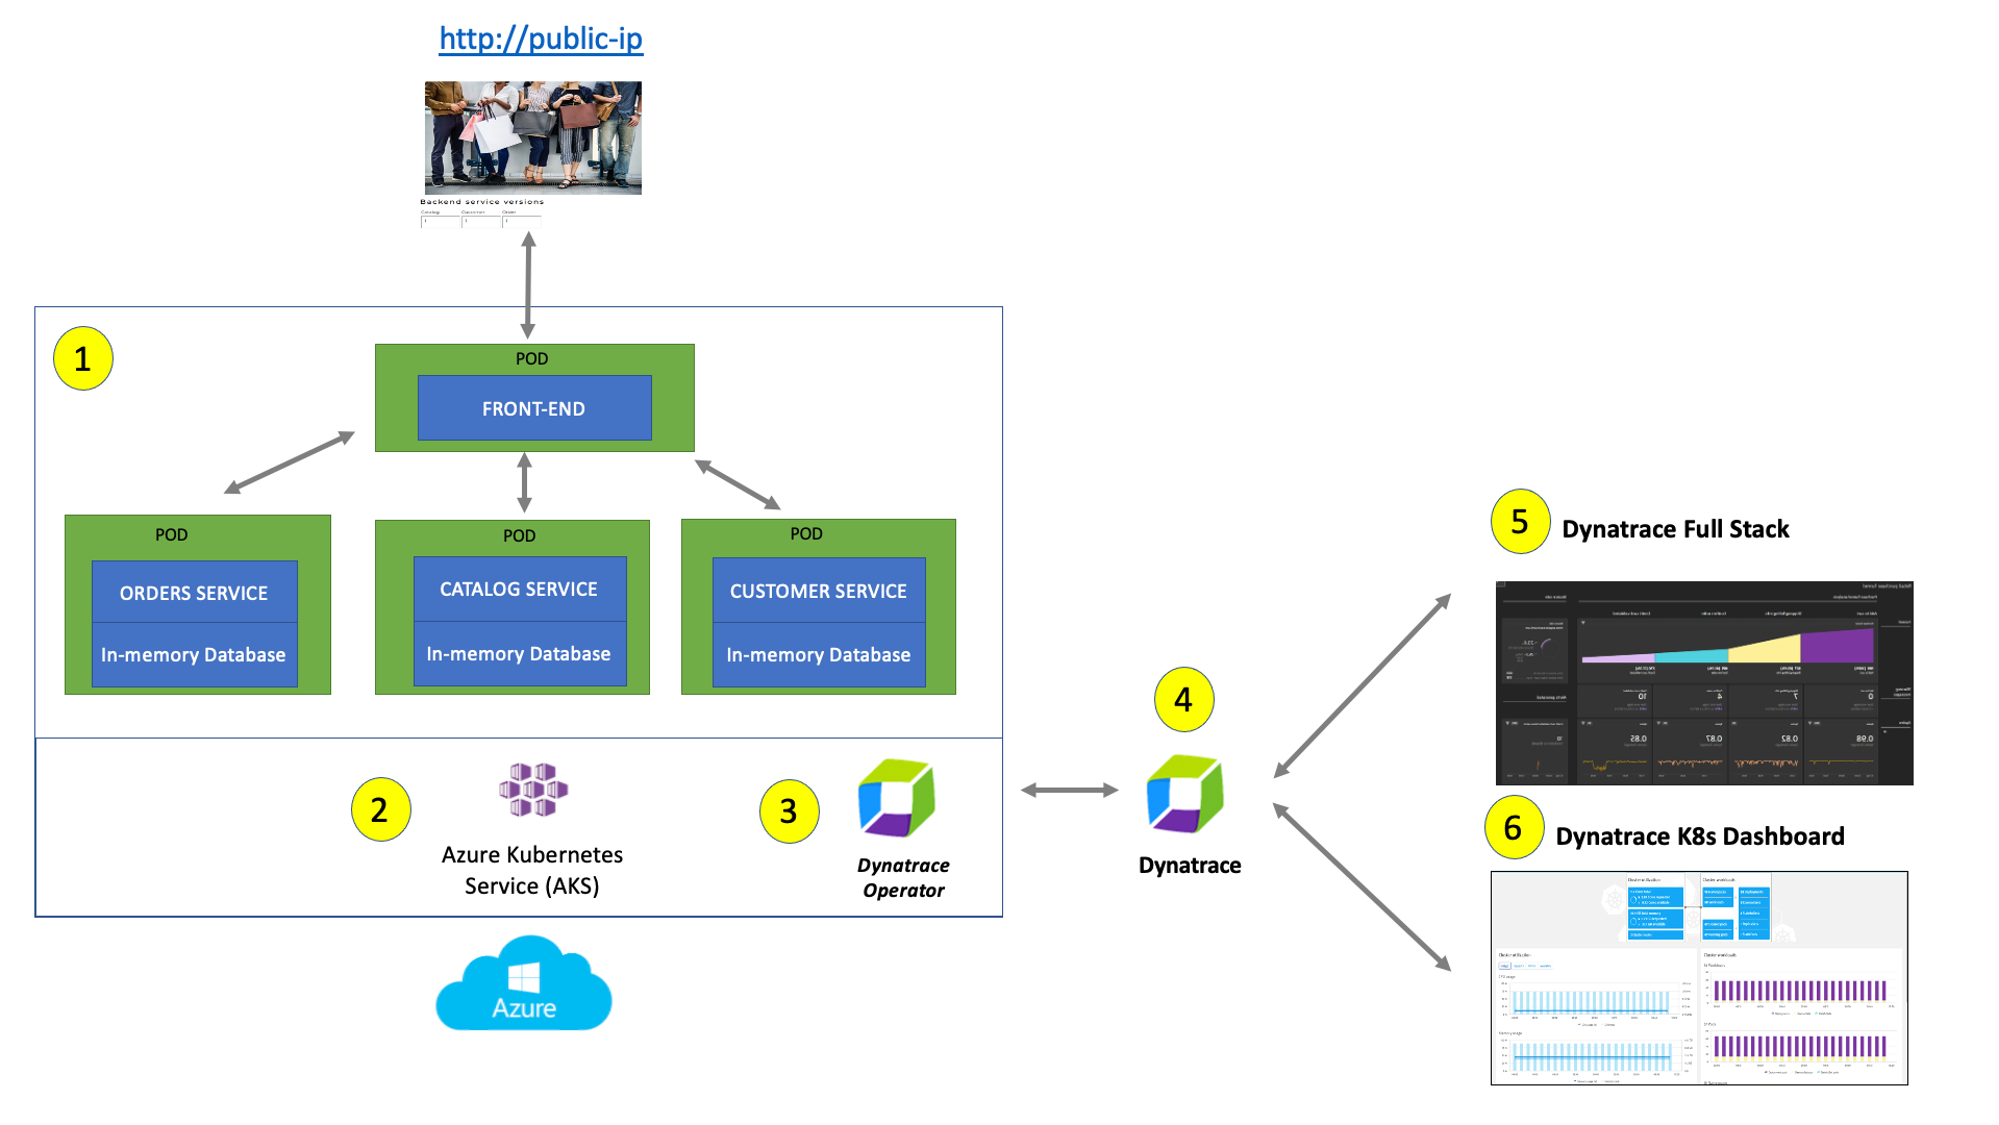
#1 . Sample Application - Representing a "services" architecture of a frontend and multiple backend services implemented as Docker containers that we will review in this lab.
#2 . Azure Kubernetes Service (AKS) - is hosting the application. The Kubernetes cluster had the Dynatrace OneAgent Operator installed. (see below for more details). Two AKS nodes make up the Kubernetes cluster. The Dynatrace OneAgent was preinstalled by the OneAgent operator and is sending data to your Dynatrace SaaS environment. (see below for more details)
#3 . Dynatrace Operator - Dynatrace OneAgent is container-aware and comes with built-in support for out-of-the-box monitoring of Kubernetes. Dynatrace supports full-stack monitoring for Kubernetes, from the application down to the infrastructure layer.
#4 . Dynatrace tenant is where monitoring data is collected and analyzed.
#5 . Full-Stack Dashboard - Made possible by the Dynatrace OneAgent that will automatically instrument each running node & pod in AKS.
#6 . Kubernetes Dashboard - The Kubernetes page provides an overview of all Kubernetes clusters showing monitoring data like the clusters' sizing and utilization.
One key Dynatrace advantage is ease of activation via Azure Portal. OneAgent technology simplifies deployment across large enterprises and relieves engineers of the burden of instrumenting their applications by hand. As Kubernetes adoption continues to grow, it becomes more important than ever to simplify the activation of observability across workloads without sacrificing the deployment automation that Kubernetes provides. Observability should be as cloud-native as Kubernetes itself.
In our workshop, we will install the Dynatrace Operator that streamlines lifecycle management. You can read more about it here in this Dynatrace Blog
Organizations will often customize the Dynatrace Operator installation and you can read more about the options in the Dynatrace Doc but, we are going to use a single command that we can get from the Dynatrace interface to show how easy it is to get started.
Tasks to complete this step
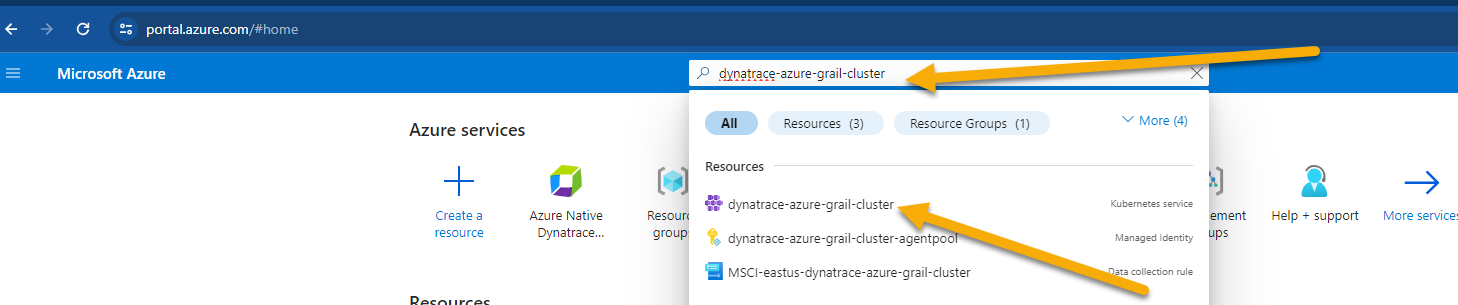
- Open up the Azure Portal and search for the AKS Cluster from the top search bar and select it once it displays under resources
- Once you're on the AKS cluster, from the left navigation, go to
Settings -> Extensions + Applications - Click on
Install an extension.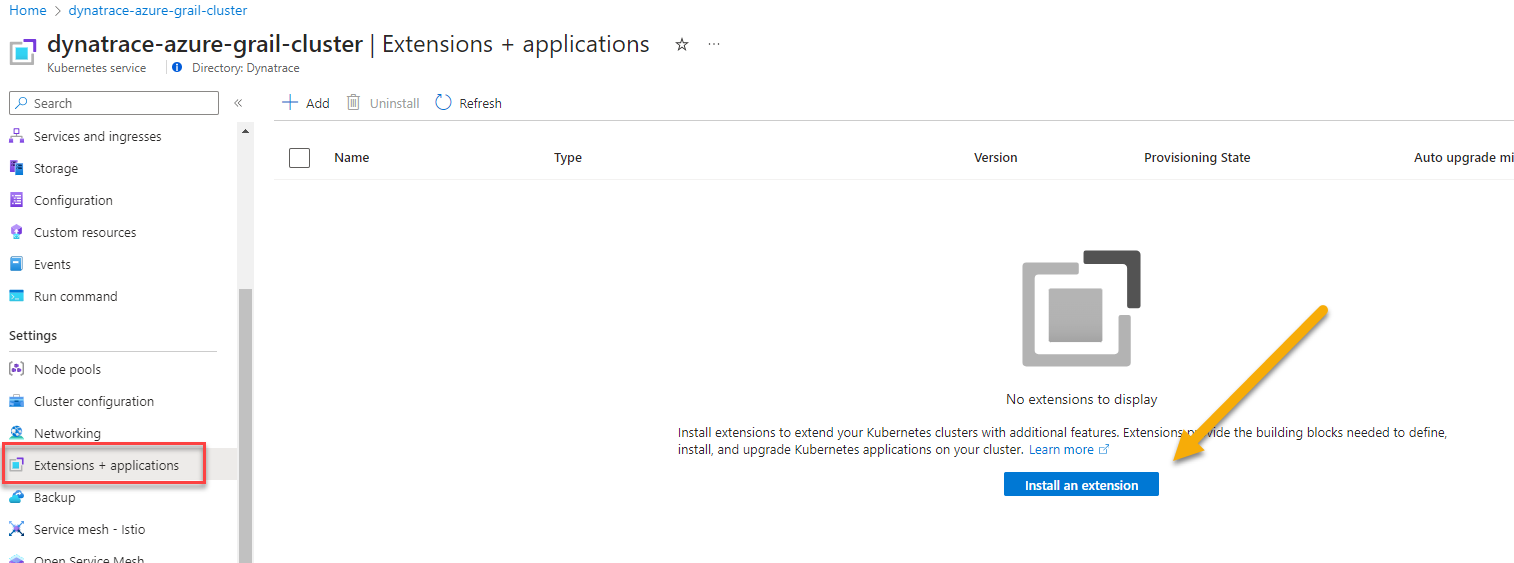
- Search Dynatrace in search bar. Click on Dynatrace Operator tile once its displayed.
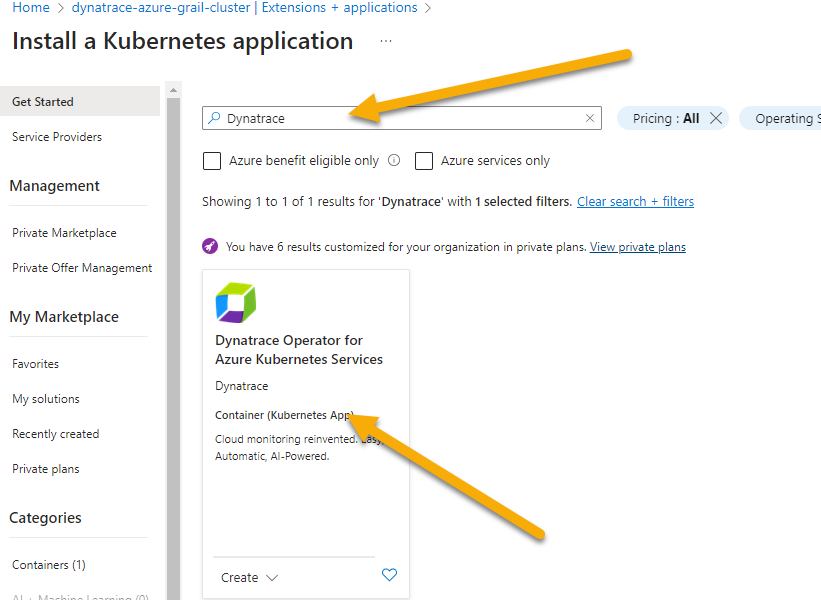
- Click create at the next screen
- On the
Basicstab, the subscription and resource group shold already be pre-selected. Just select the AKS Cluster from the drop down.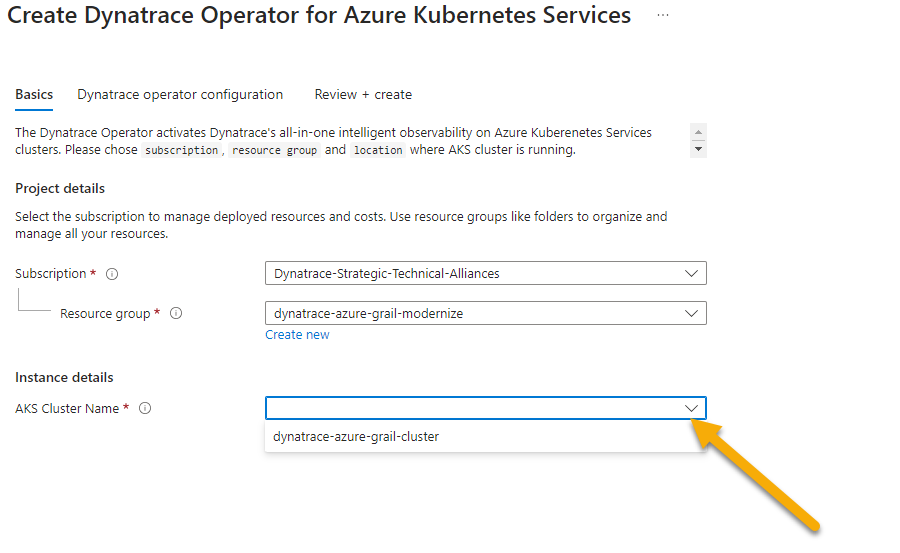
- On the
Dynatrace Operator Configurationhere are the values to fill inAKS extension resource name: dynatraceazuregrailDynatrace operator token: token value from notepad saved from earlier stepData ingest token: token value from notepad saved from earlier stepAPI URL: URL value from notepad saved from earlier stepOneAgent Deployment Type: cloud native full stack

- Click on
Review + Createand clickCreateon the next screen. - After the deployment is complete, go into Dynatrace -> From the left menu select
Appsand bring upKubernetes Classicapp.- Within a couple of minutes, you will cluster and some of the metrics start to show up.
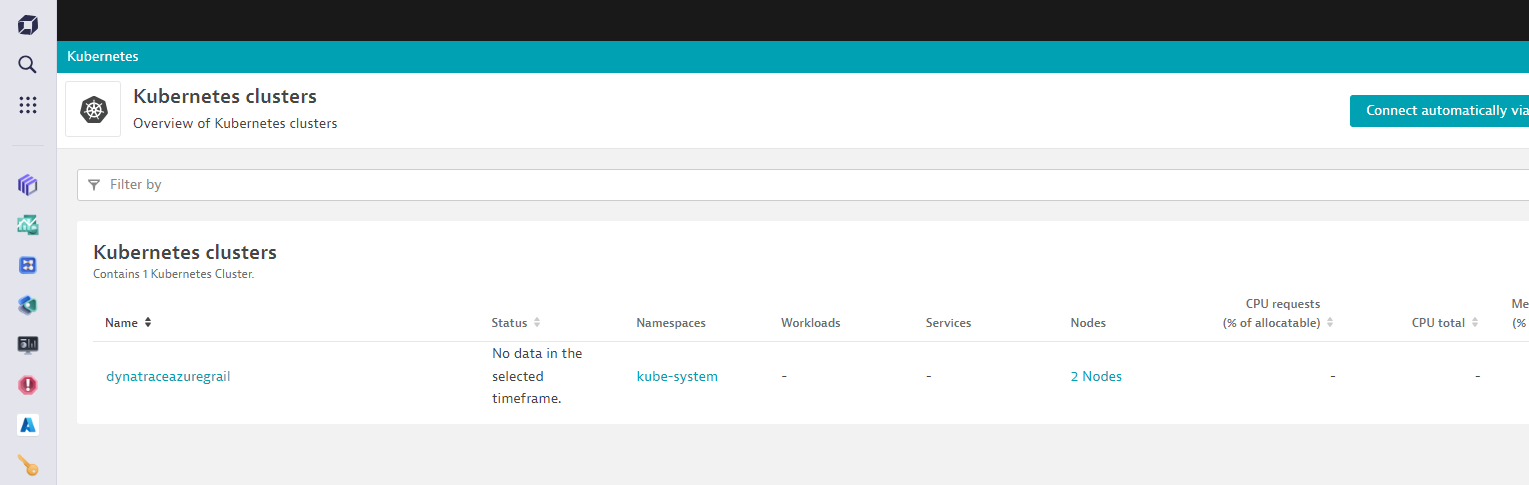
- Within a couple of minutes, you will cluster and some of the metrics start to show up.
In this step we'll walk through deploying the sample app that is now "modernized" into a microservices based app to the Azure Kubernetes cluster.
We'll use a shell script to deploy the sample application. Below you'll learn some details around what that shell script is doing and YAML file parmeters that Dynatrace uses to define and configure your application in Kubernetes.
Tasks to complete this step
- Deploy the Sample App to Kubernetes
- In the Azure Cloud Shell, run these commands:
cd ~/azure-modernization-dt-orders-setup/app-scripts ./start-k8.sh - The Kubernetes take a few minutes to come to a running, rerun this command until all the pods are in
Runningstatus.
The output should look like this:kubectl -n staging get podsNAME READY STATUS RESTARTS AGE browser-traffic-5b9456875d-ks9vw 1/1 Running 0 30h catalog-7dcf64cc99-hfrpg 1/1 Running 0 2d8h customer-8464884799-vljdx 1/1 Running 0 2d8h frontend-7c466b9d69-9ql2g 1/1 Running 0 2d8h load-traffic-6886649ddf-76pqf 1/1 Running 0 2d8h order-6d4cd477cb-9bvn4 1/1 Running 0 2d8h
- In the Azure Cloud Shell, run these commands:
In this step we will review the Sample app that we modernized and deployed to Kubernetes. Refer to this picture for a more detailed description of our setup.
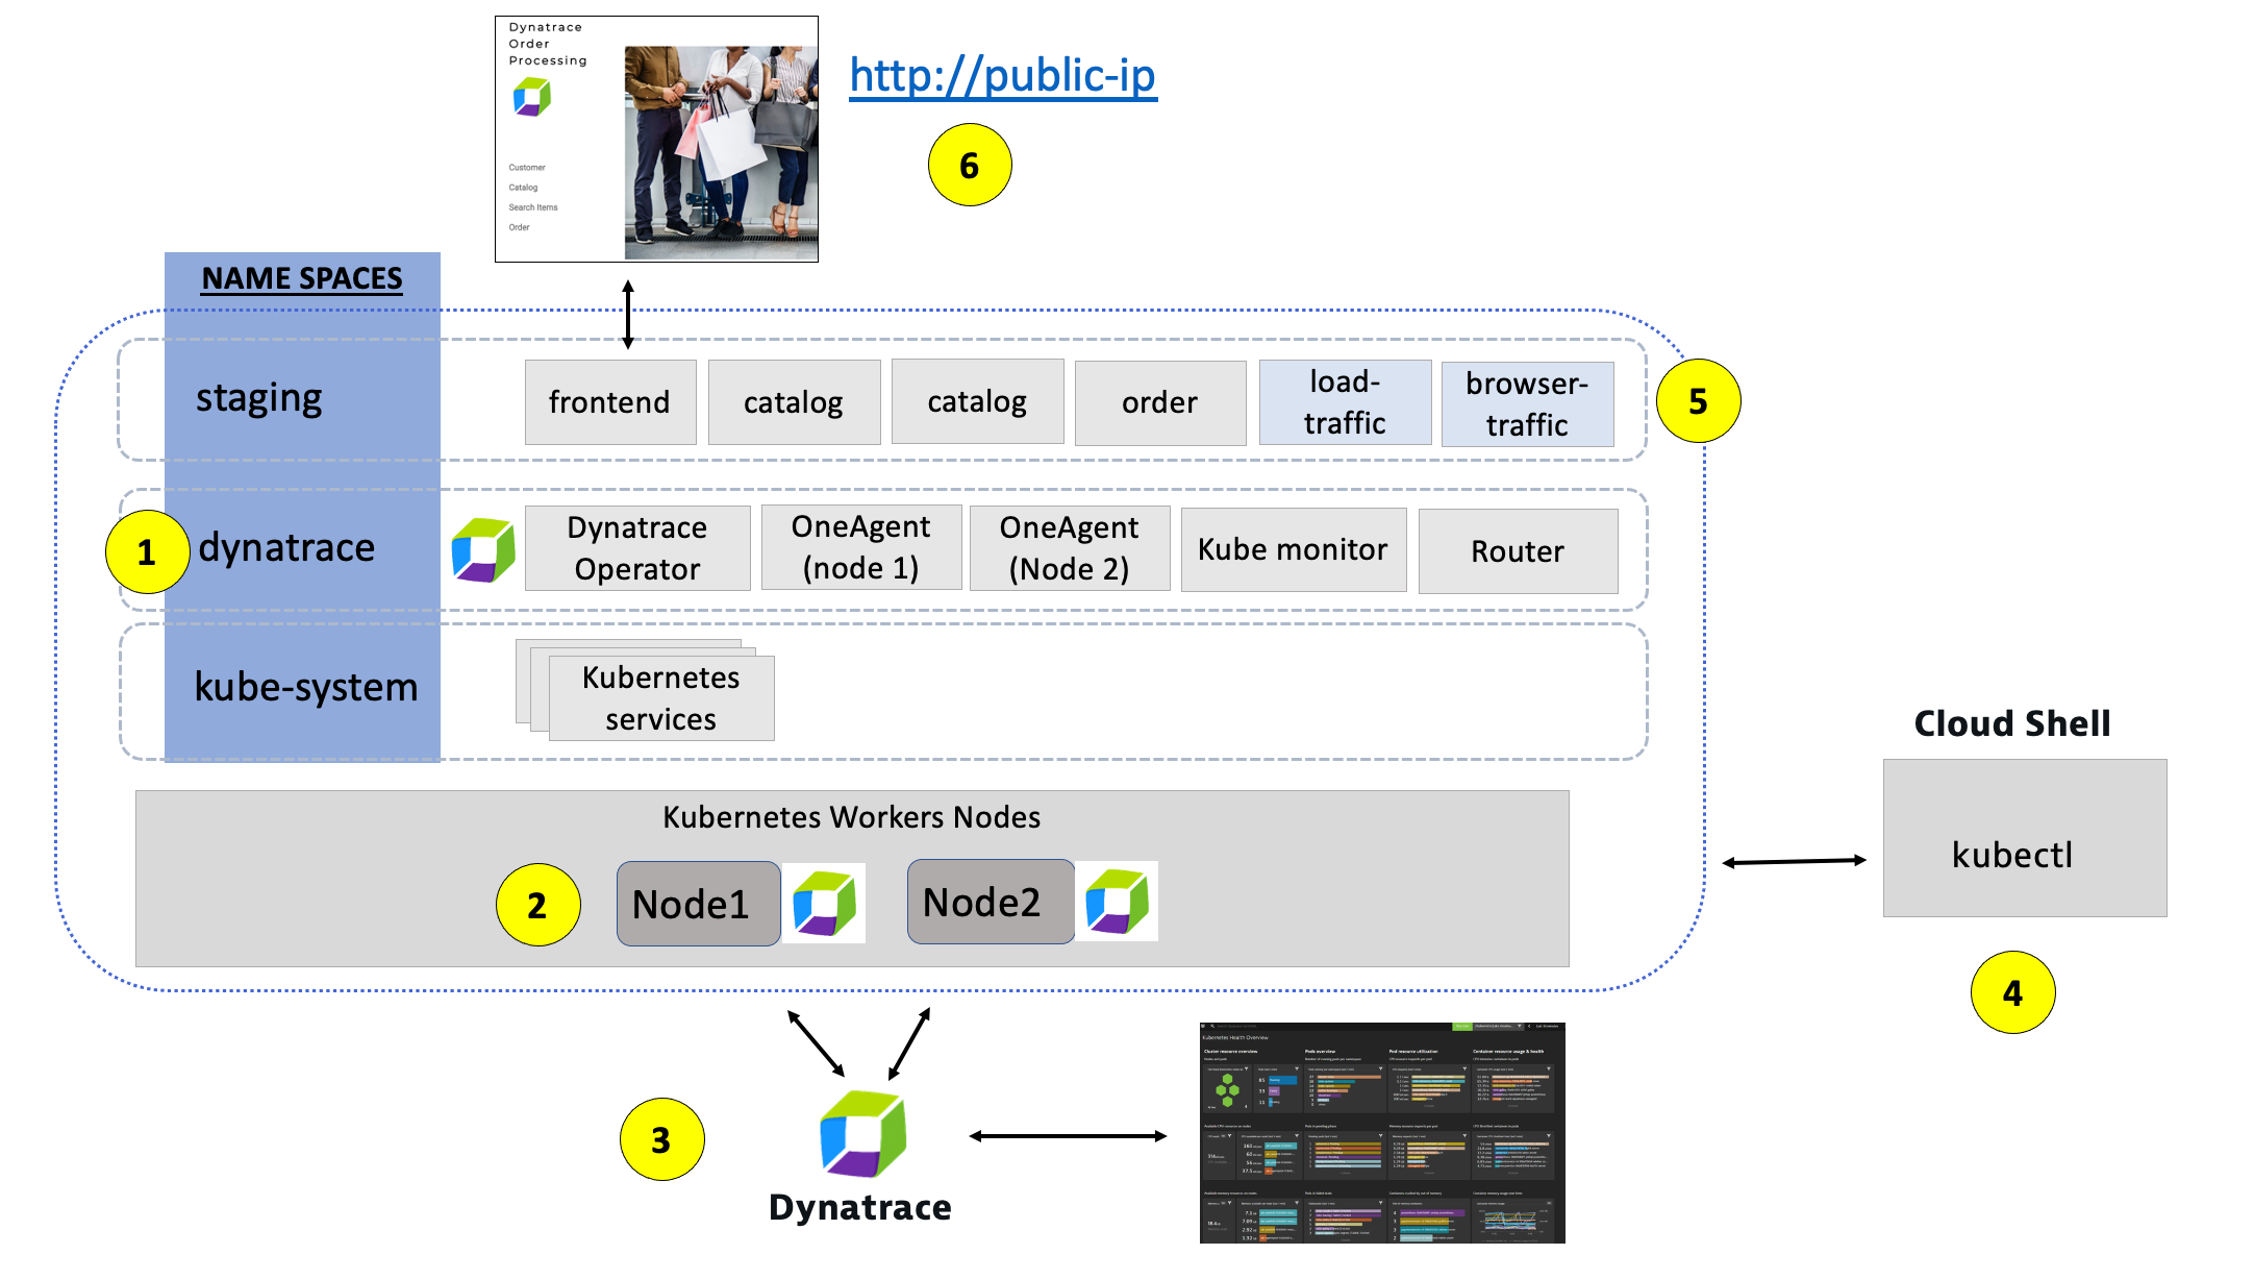
1 - Dynatrace Namespace
This Kubernetes Namespace contains the pods and services that make up the Dynatrace Operator.
2 - Kubernetes nodes
Kubernetes runs your workload by placing containers into Pods to run on [Nodes] Nodes .
3 - Dynatrace
Dynatrace tenant where monitoring data is collected and analyzed.
4 - Cloud shell
The shell is configured with the kubectl command line tool that lets you control Kubernetes clusters.
5 - Sample application namespace
This Kubernetes Namespace contains the sample application pods and services.
6 - Sample application
The frontend service is exposed as a public IP and is accessible in a browser.
Tasks to complete this step
- Validate Sample App is accessible via browser
- To view the application, we need to get the IP address assigned to the Kubernetes service for the sample application.
- Go back to the window where you have Azure Cloud shell open
- From the Azure Cloud Shell SSH command prompt type this command
kubectl -n staging get svc - From the output, copy the entire value from EXTERNAL-IP and
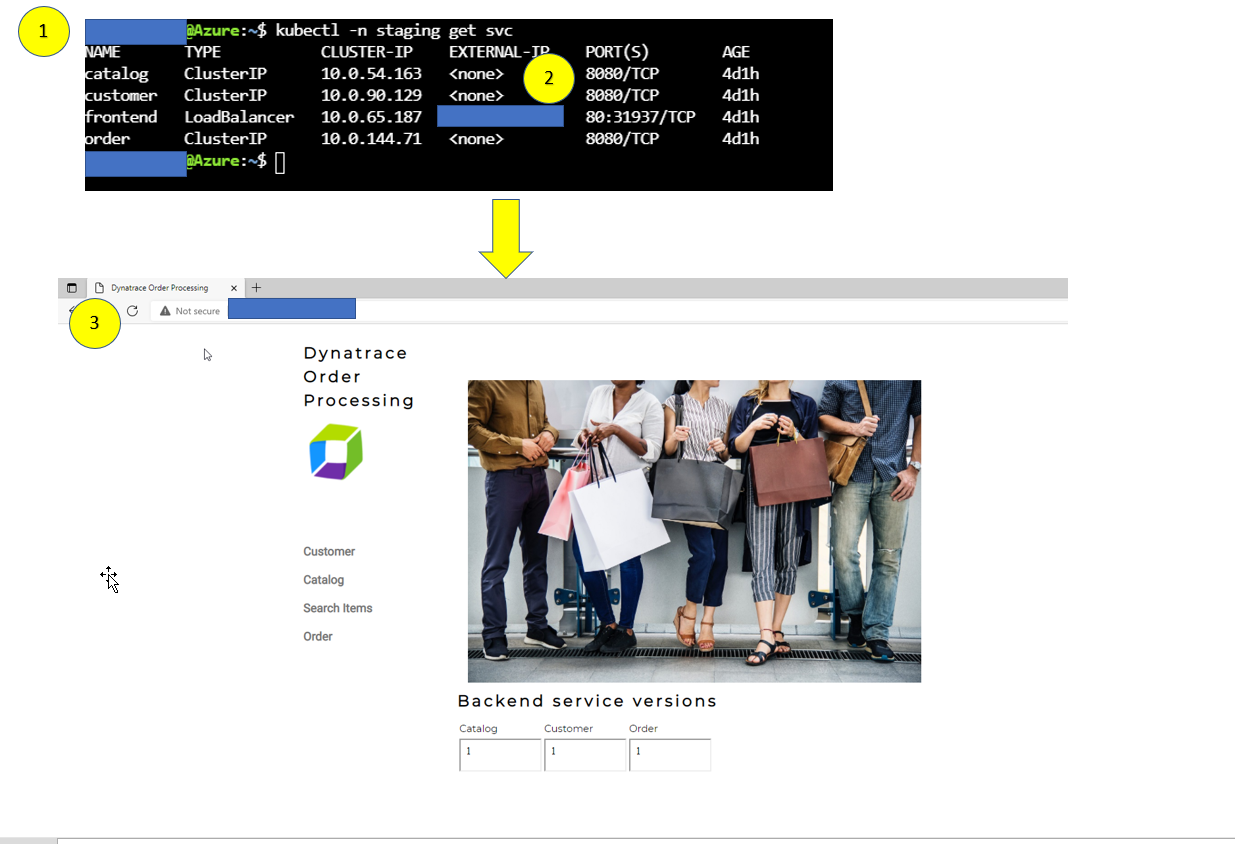
- Open a browser window. Type in IP address similar to this
http://11.22.33.11for the example above. The output and application should look like the above browser window
- To view the application, we need to get the IP address assigned to the Kubernetes service for the sample application.
- Explore the Sample App on Kubernetes
- Use the menu on on the home page to navigate around the application and notice the URL for key functionality. You will see these URLs later as we analyze the application.
* Customer List = customer/list.html
* Customer Detail = customer/5.html
* Catalog List = catalog/list.html
* Catalog Search Form = catalog/searchForm.html
* Order List = order/list.html
* Order Form = order/form.html
- Use the menu on on the home page to navigate around the application and notice the URL for key functionality. You will see these URLs later as we analyze the application.
Kubernetes events monitoring for analysis and alerting
For full observability into your Kubernetes events, automatic Davis analysis, and custom alerting, you need to enable Kubernetes event monitoring & Log ingest into Dynatrace
Tasks to complete this step
- In the Dynatrace UI, Go to Apps list from menu on the left and open up `Kubernetes Classic"

- Open up the AKS Cluster
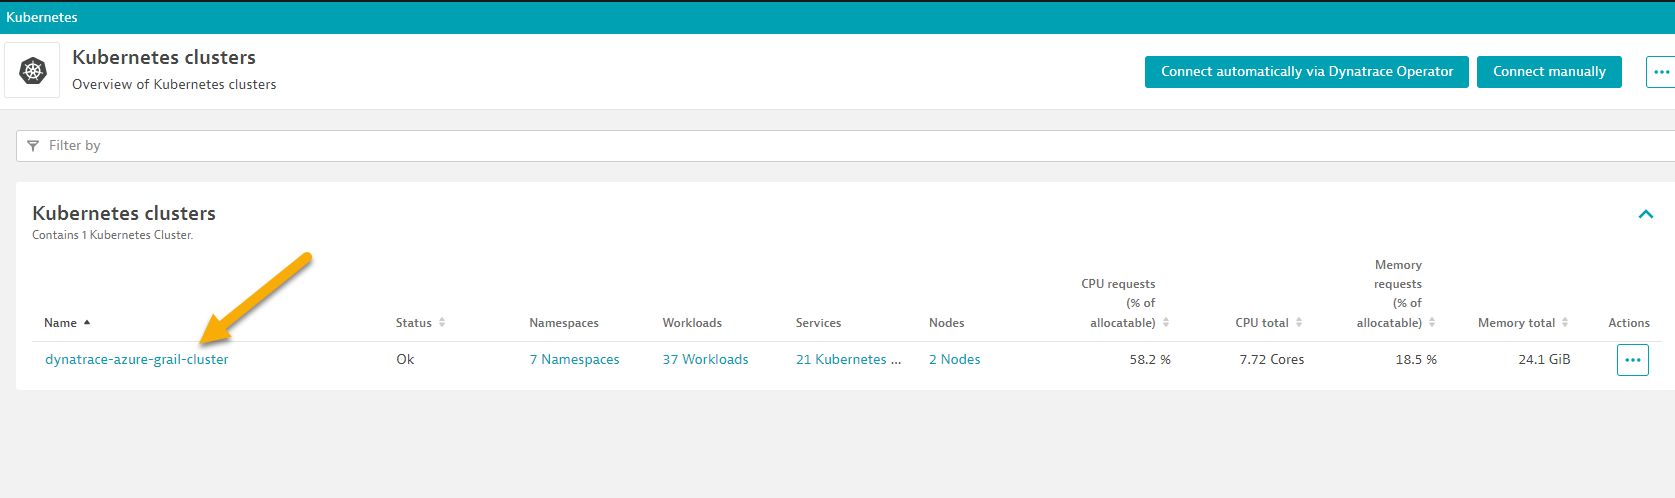
- Once you're in Overview of Kubernetes cluster, scroll down to bottom to Events and Logs section
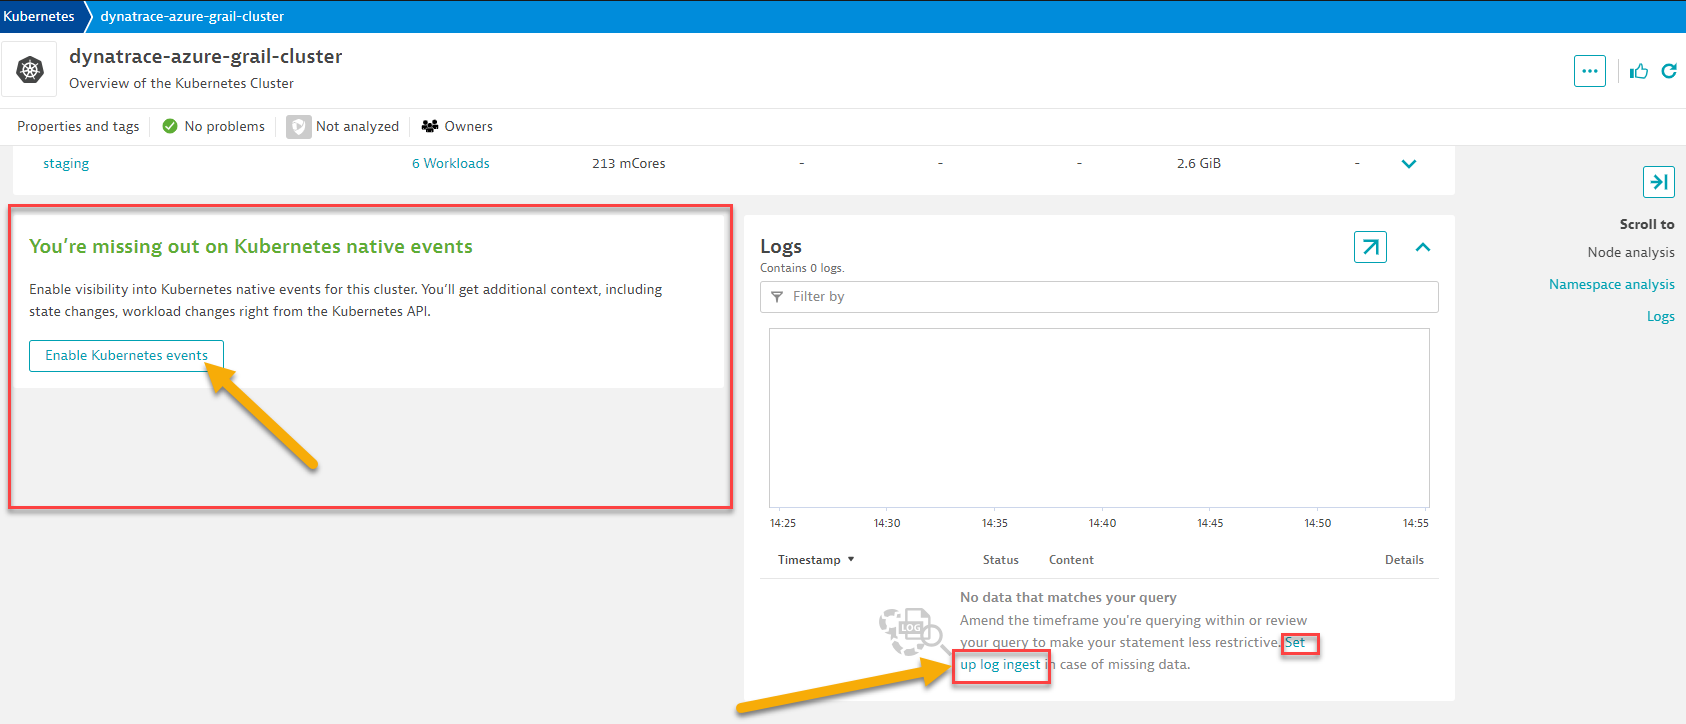
- Click on the button first to
Enable Kuberenetes Events. On the next screen click on Monitor events and click Save bottom.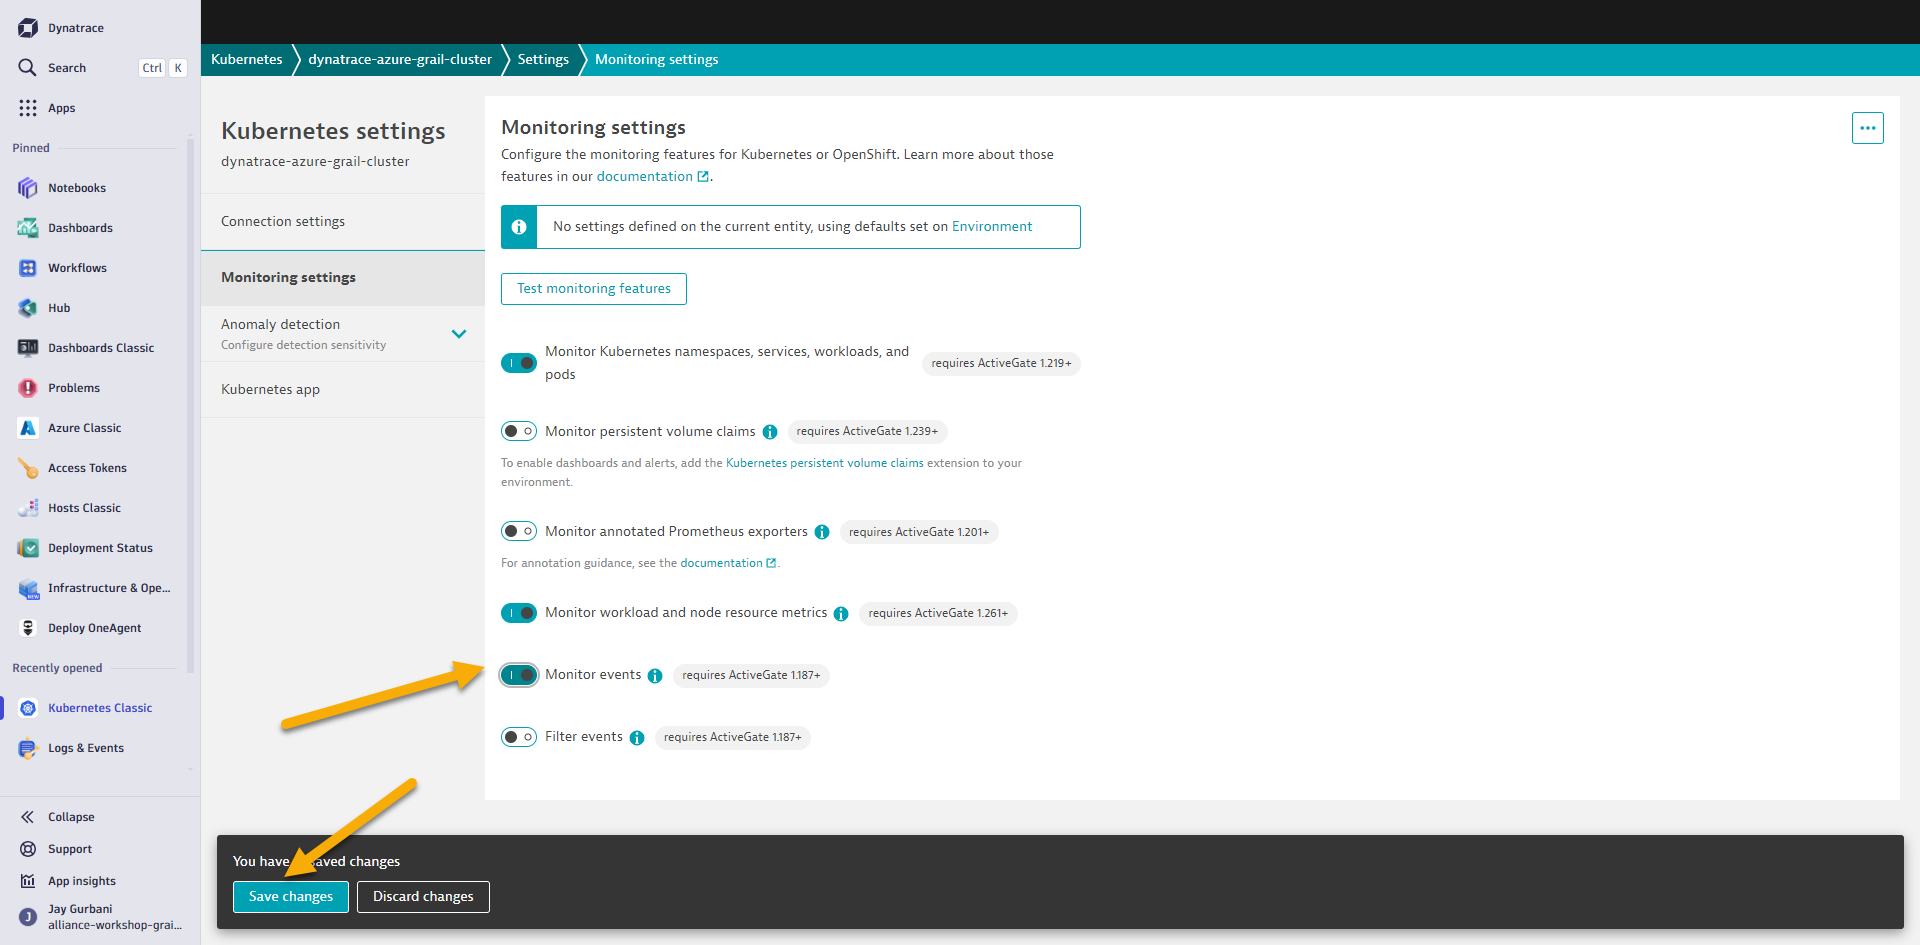
- To navigate back to your cluster overview screen, click on cluster name at the breadcumb menu at the top
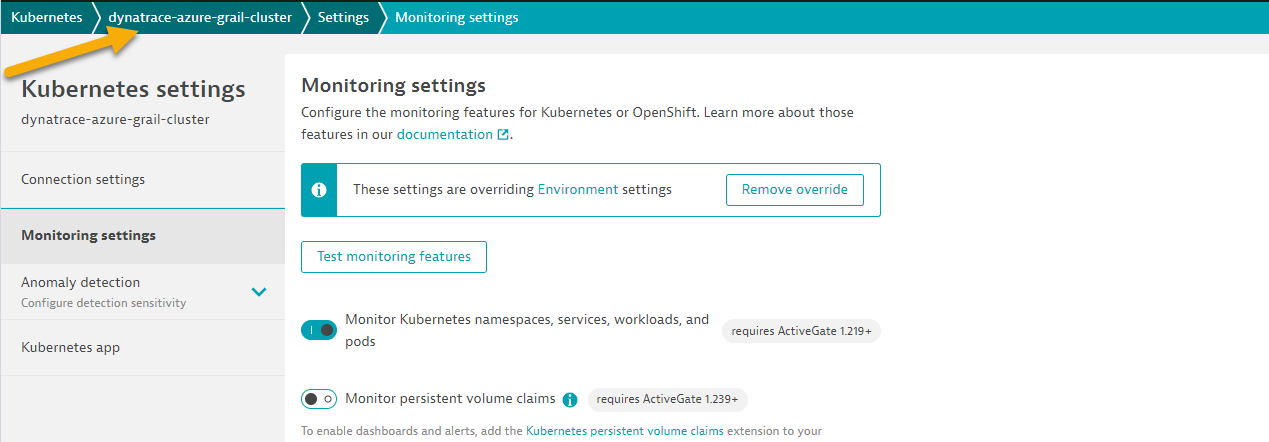
- Scroll down to the bottom to Events and Logs section. This time click on link
Set up log ingestto capture log data for the cluster. - Scroll to the top of the log ingest screen and enable
Ingest all detected log sources.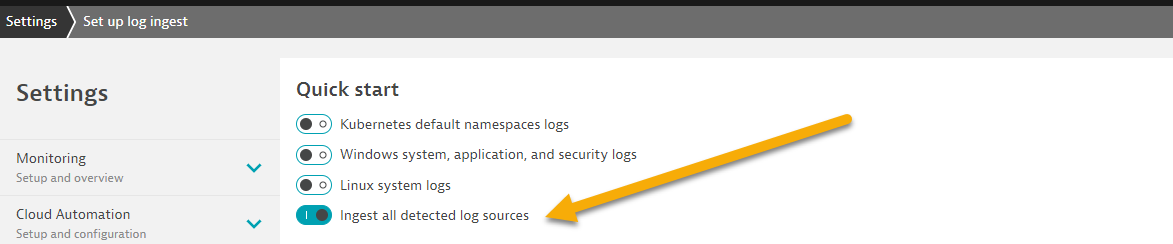
- To navigate back to your cluster overview screen, click on
Kubernetes Classicapp from the left navigation menu.
In this step we will walk through the different Dynatrace dashboards that are available out of the box for monitoring Kubernetes.
Tasks to complete this step
- Validate AKS ActivateGate visible in Dynatrace UI
- Go to the Dynatrace UI.
- From the menu on the left, click
Apps --> Deployment statusto review OneAgent Deployment status - Within the
Deployment statuspage, next click on theActiveGateoption to review the Active Gate.
- Review Kubernetes Dashboards are accessible from the left-side menu in Dynatrace choose
Apps --> Kubernetes Classicand navigate to the Kubernetes cluster page as shown below:
📓Note: Be sure that your management zone is NOT filtered!**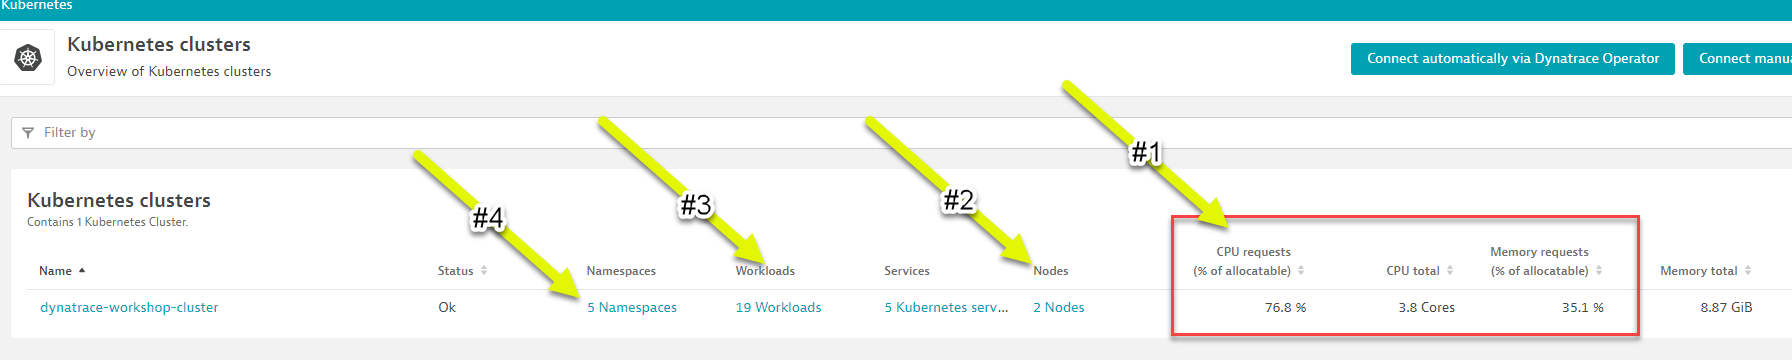 1 - Kubernetes cluster - A summary the Kubernetes cluster metrics are shown on the right.
2 - Nodes - The resources for the Cluster are summarized for the one-to-many hosts or Cluster nodes in this view. To explore specific node metrics in the `Node Analysis`` section, click into the cluster scroll to that section on the right.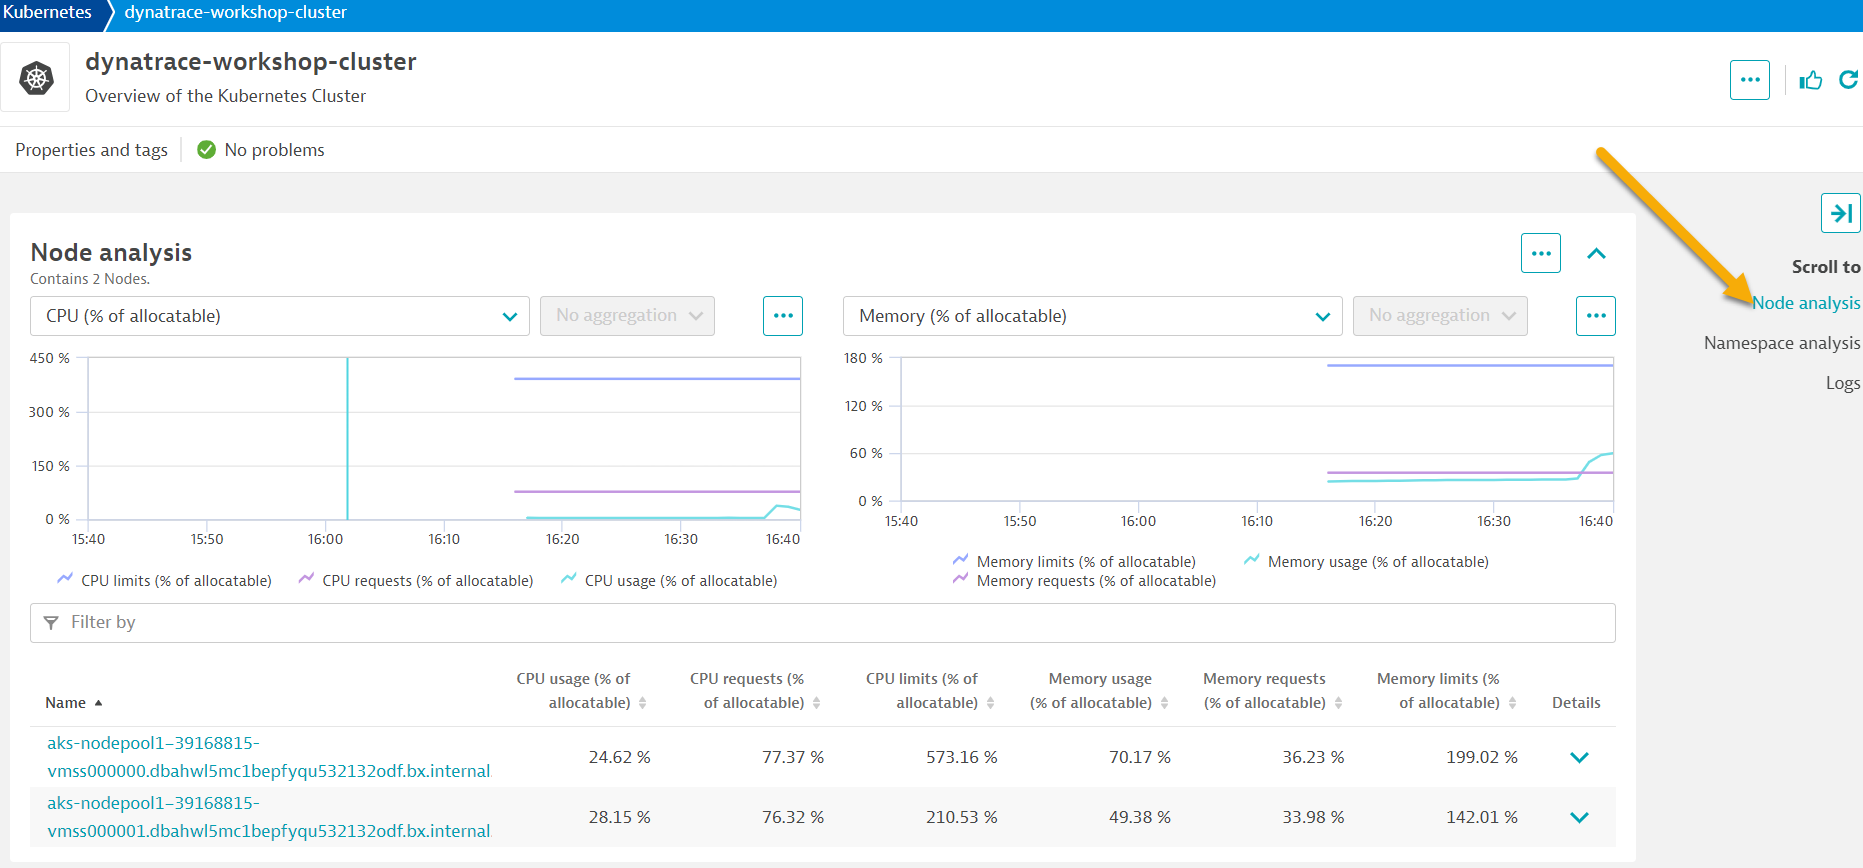 3 - Namespaces - Namespaces are ways to partition your cluster resources to run multiple workloads (for example
 application Aandapplication Bworkloads) on same cluster- This
Namespace analysissection shows workloads metrics over time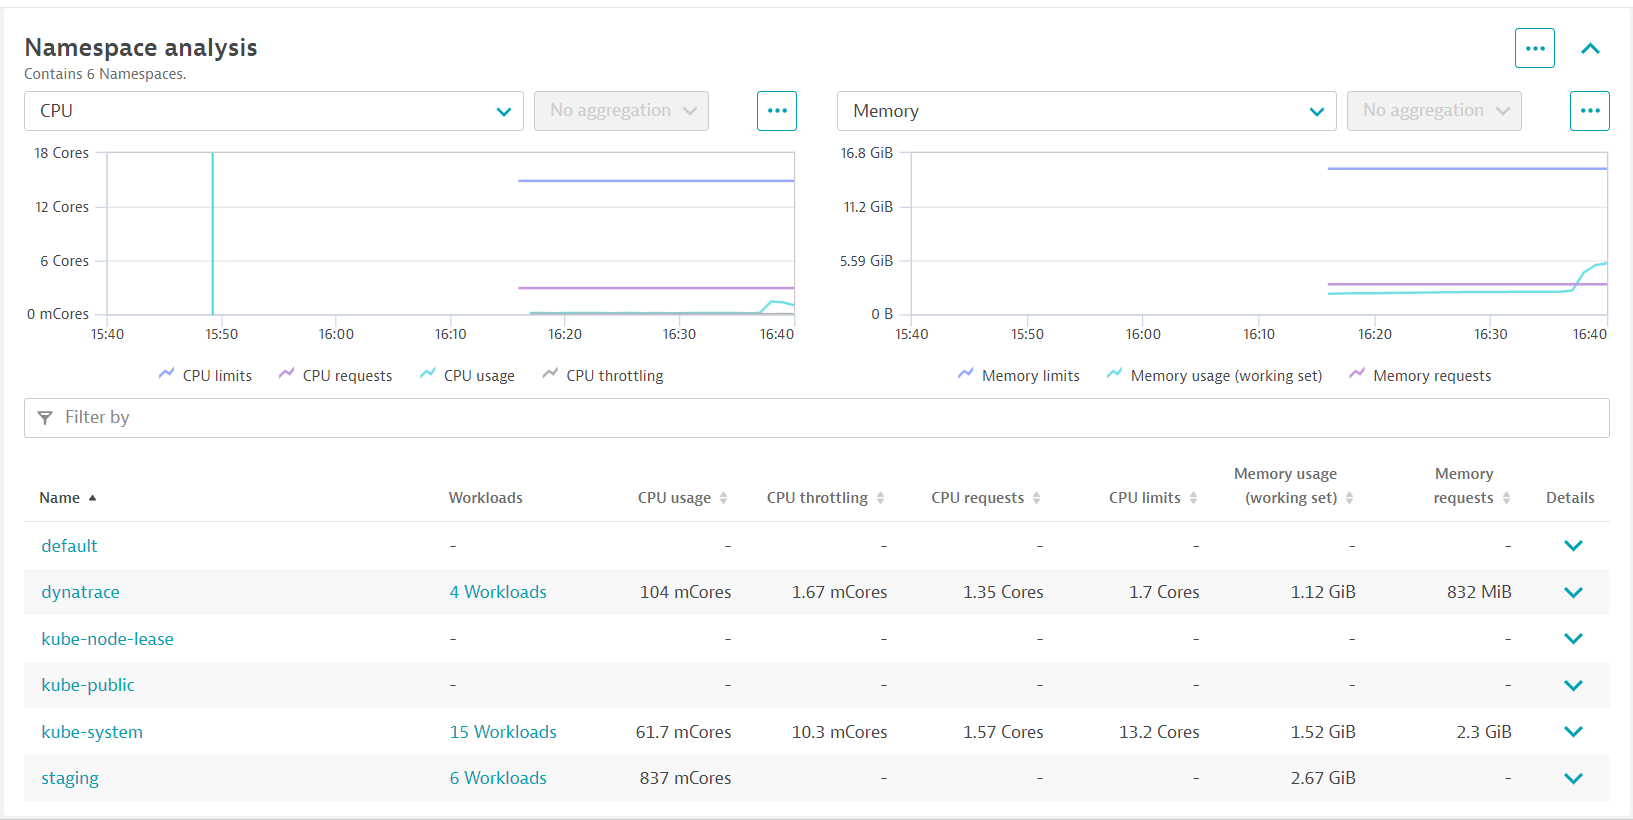
- In the
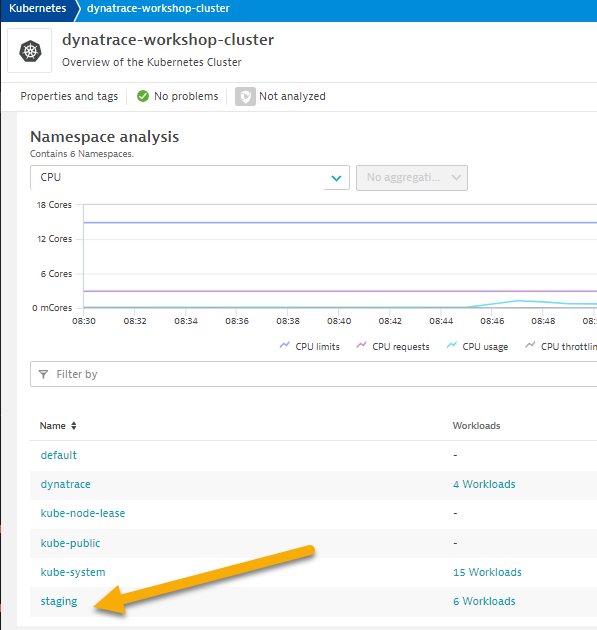
Namespace Analysissection, pick the view allstagingnamespace.
- In the filter, pick namespace then staging
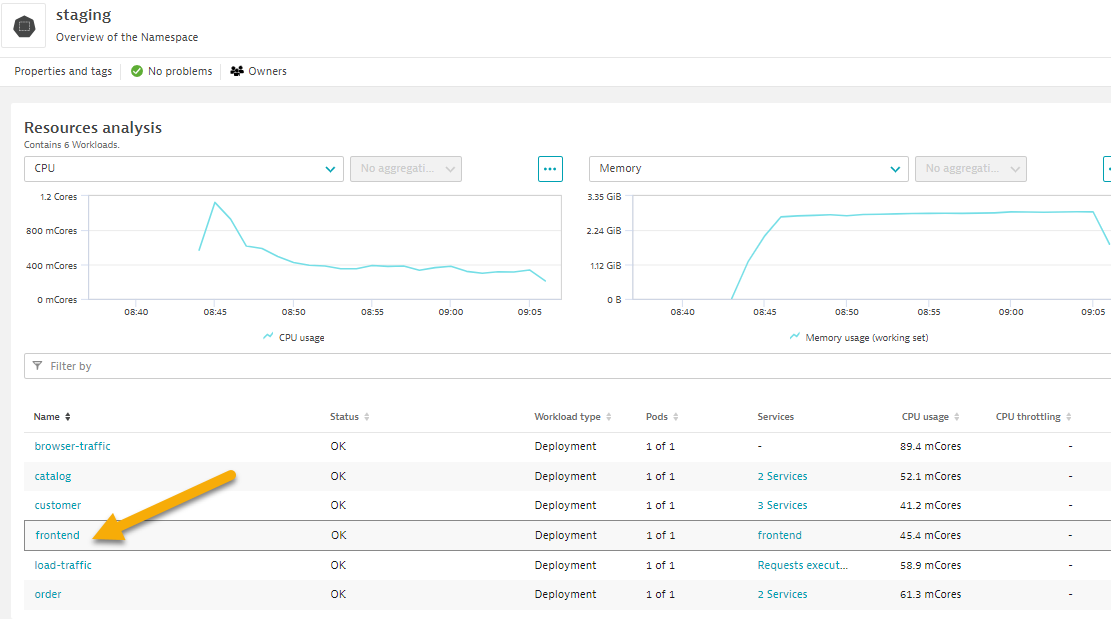
- Pick the frontend to drill into.
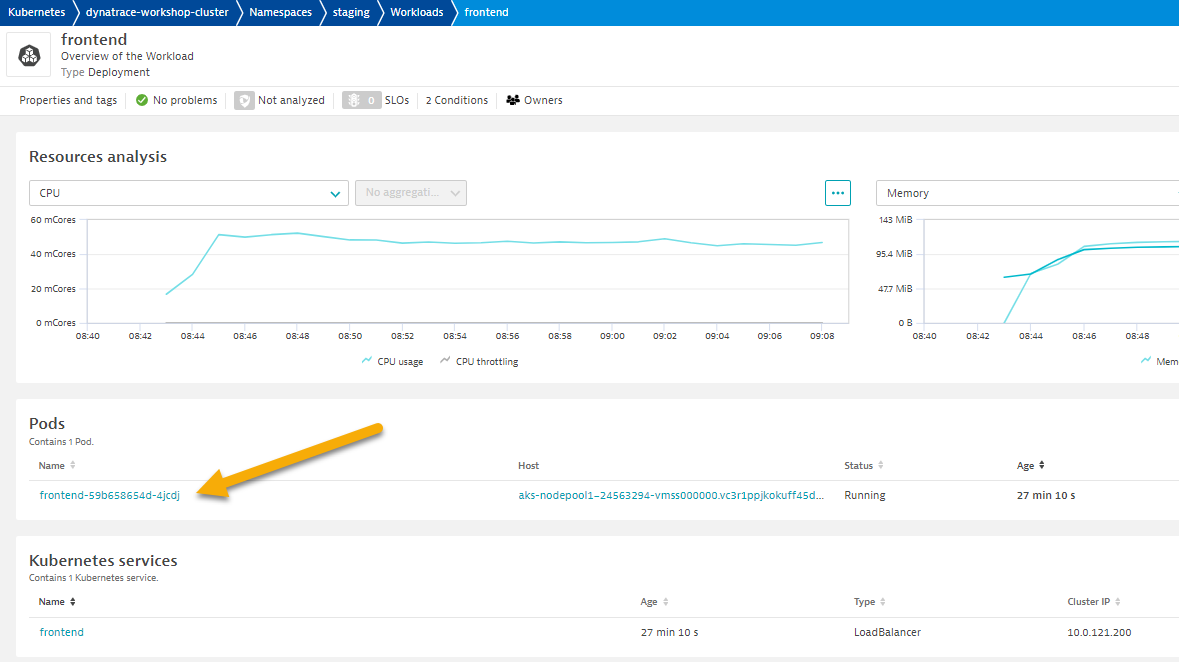
- Review the workload overview page to look at various metrics related to the workload.
- Click on Kubernetes POD to look at POD utilization metrics.
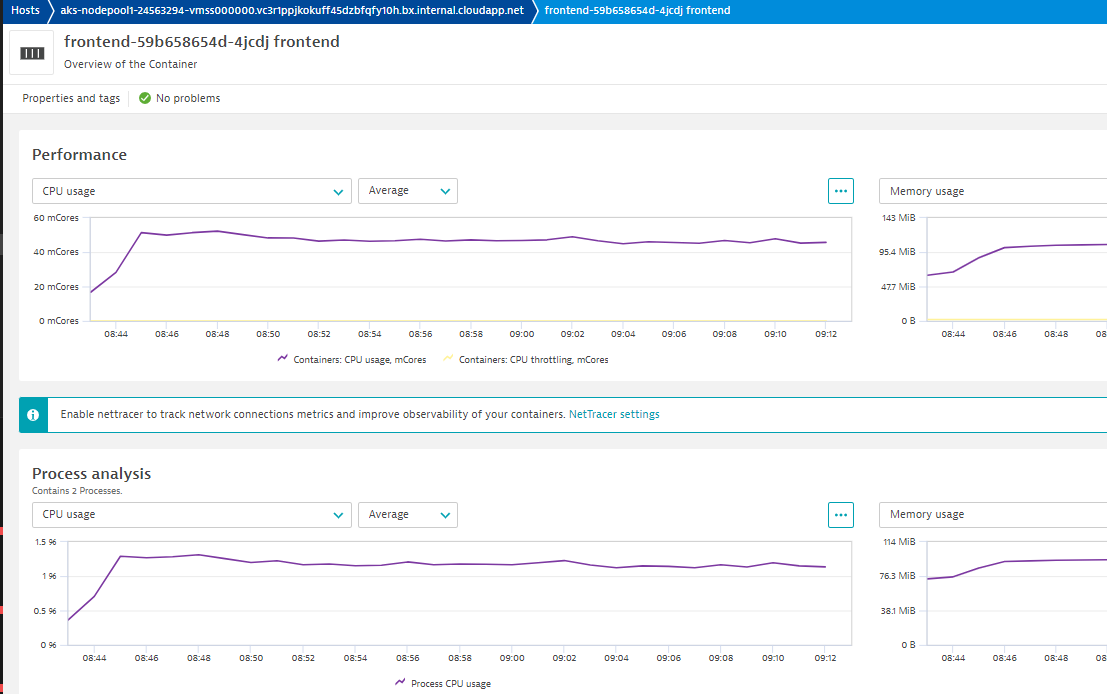
- Click on Container next to look at container metrics
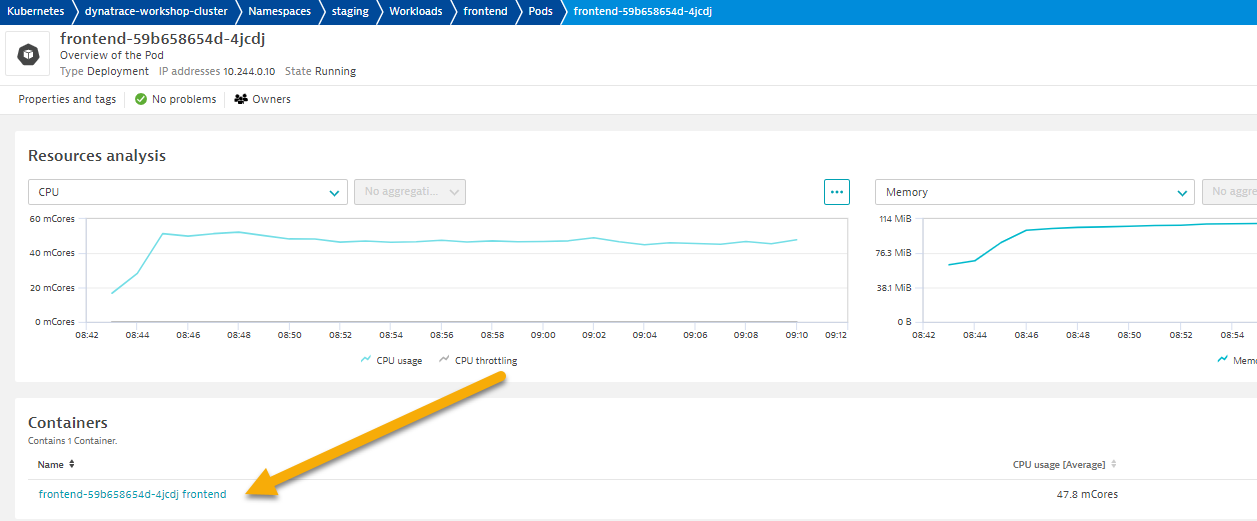
- Container information
- Kubernetes information
- In the info graphic, pick the service to open the services list
- In the service list, click on k8-frontend service
- Under the
process analysissection, click on 2ndstaging-frontendProces Icon to review the services running inside the container
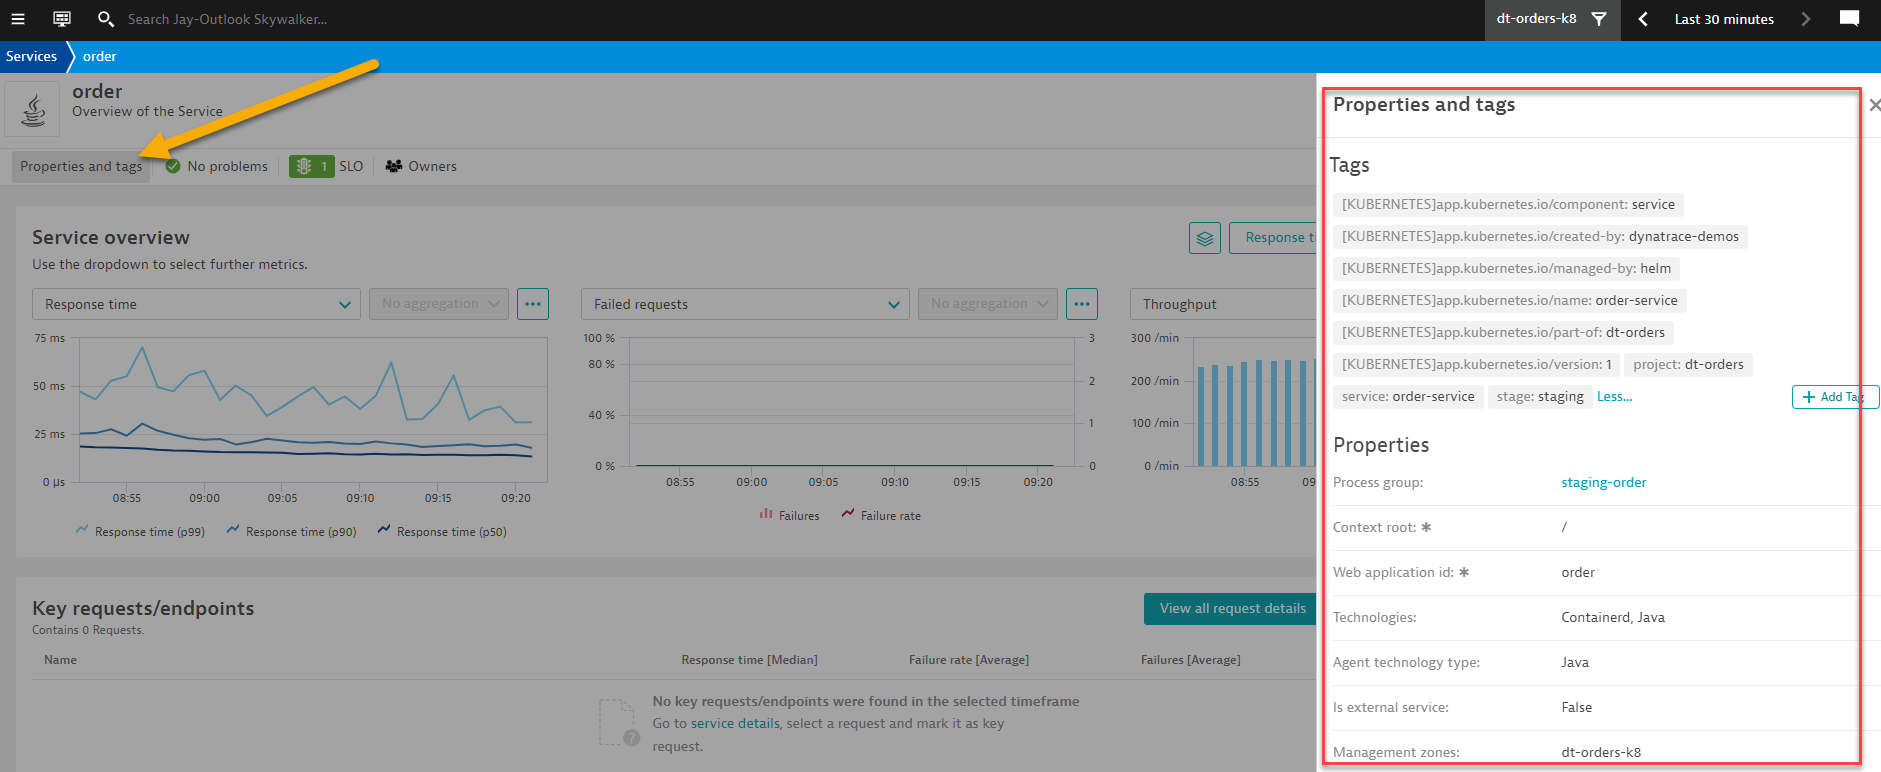
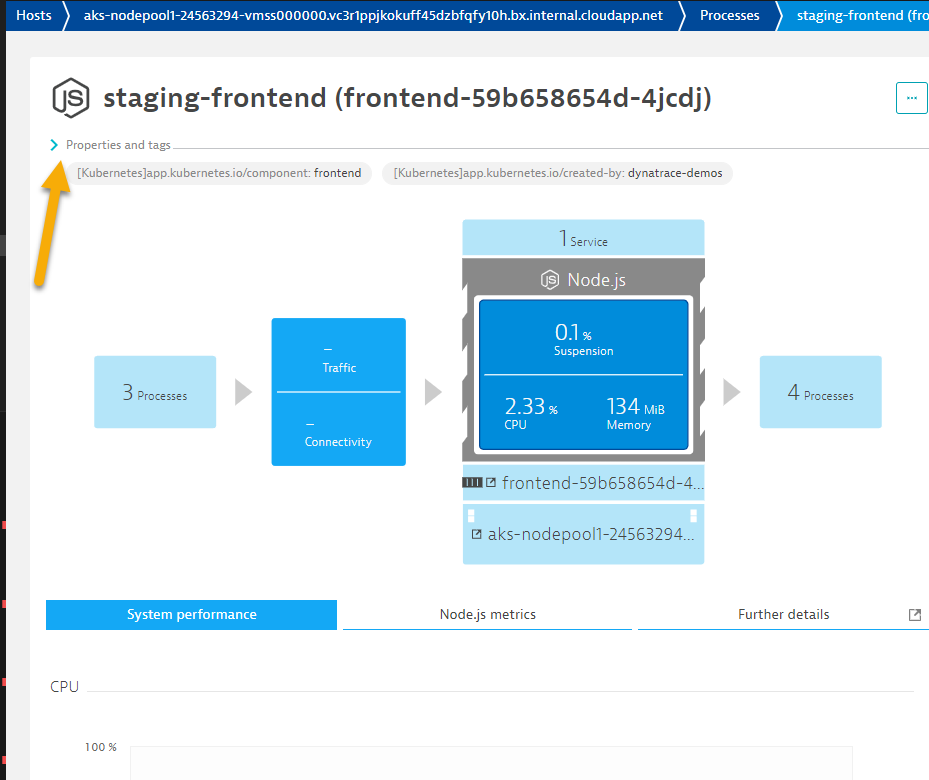 📓Note: If you expand the
 Properties and TagSection, you'll notice the various Kubernetes information that is also available for this service. - This
Now that we've modernized the application and installed it on Kubernetes, we still need to trace the application transactions from front to back.
Dynatrace understands your applications transactions from end to end. This transactional insight is visualized several ways like the backtrace.
The backtrace tree view represents the sequence of services that led to this service call, beginning with the page load or user action in the browser.
Dynatrace also gives you insight into what Kubernetes cluster, node, workload, and namespace that service is running on.
Tasks to complete this step
- Review Services View for
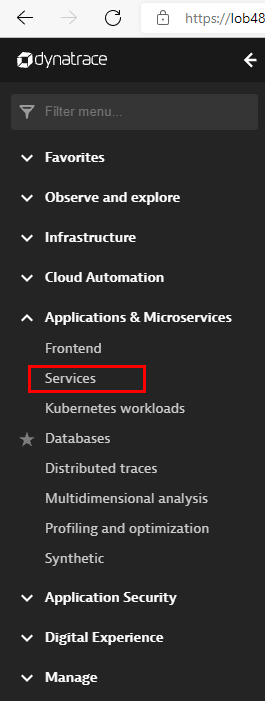
orderservice- Left Menu -> Applications & Microservices -> Services
- Top Menu -> filter by
dt-orders-k8 managementzone.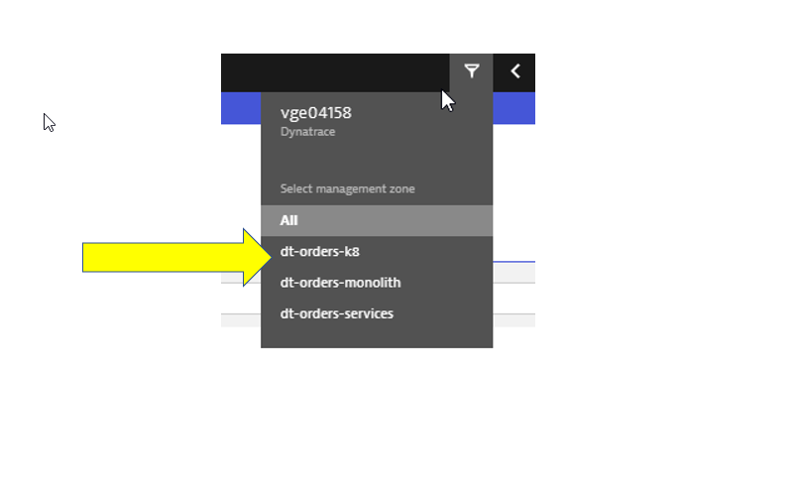
- Pick the
orderservice.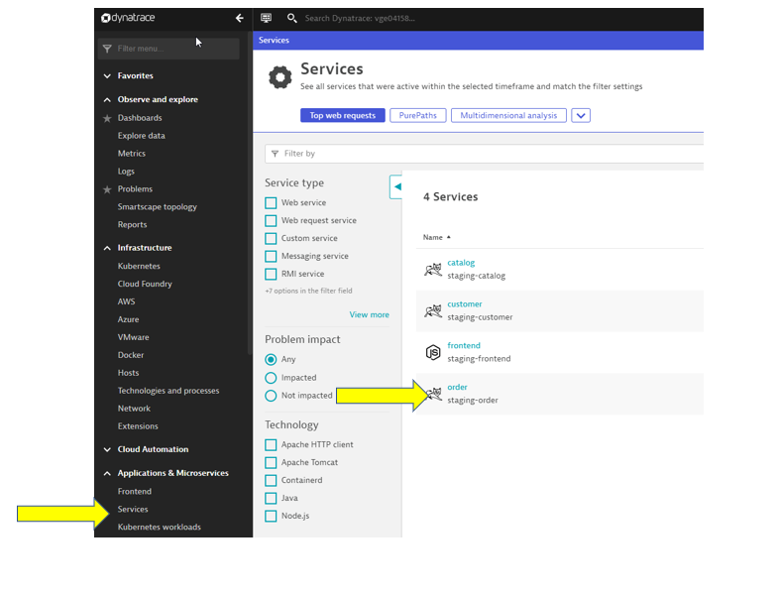
- On this service, we can quickly review the inbound and outbound dependencies.
- Referring to the picture, within the services infographic, click on the "services" square to get a list of the services that the order service calls.
- Left Menu -> Applications & Microservices -> Services
- Review Backtrace View
- To see the backtrace page, scroll down to the
Topologysection just click on theView Backtracebutton. - You should be on the service backtrace page where you will see information for this specific service.
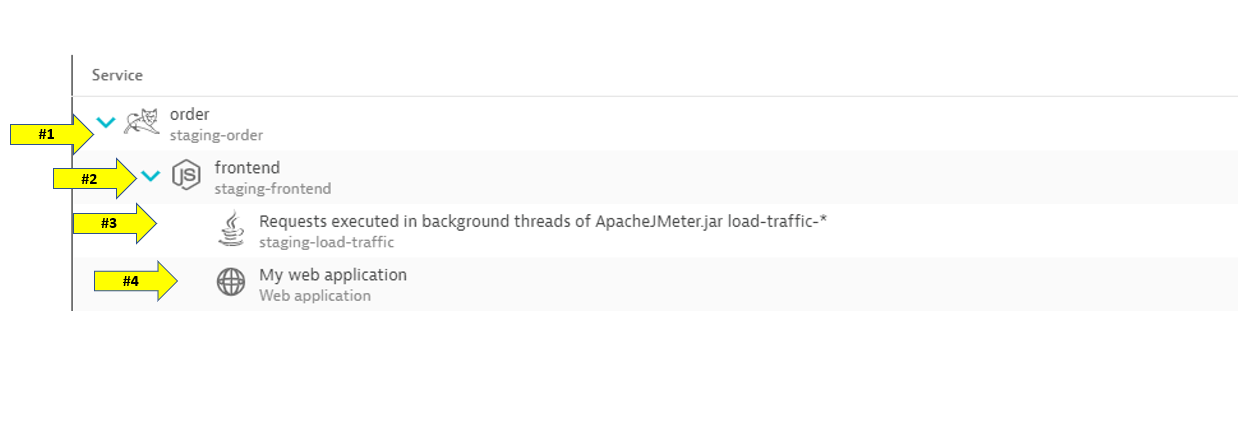
- This will get more interesting in the next lab, but for the monolith backend, we can see that the backtrace is as follows:
- The starting point is the backend
- Backend service is called by the front-end
- Front-end is a where end user requests start and the user sessions get captured
- My web application is the default application that Dynatrace creates
- To see the backtrace page, scroll down to the
In this step we will walk through the Service Flow view within Dynatrace and see what's different now that its deployed on Kubernetes.
Tasks to complete this step
- Review Services View for
Frontendservice- Left Menu -> Applications & Microservices -> Services
- Top Menu -> filter by
dt-orders-k8 managementzone. - Pick the
frontendservice.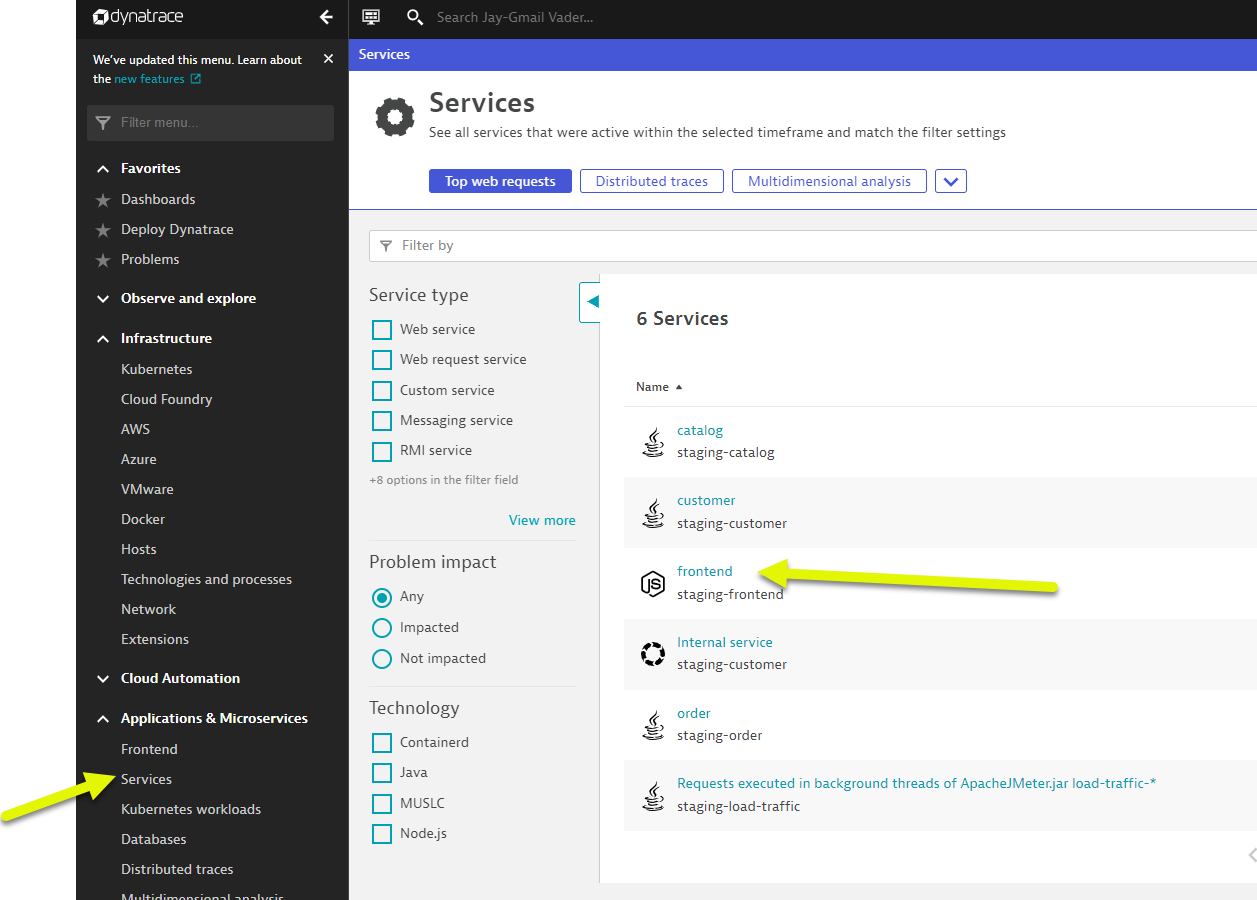
- Just click on the
service flowbutton to open this.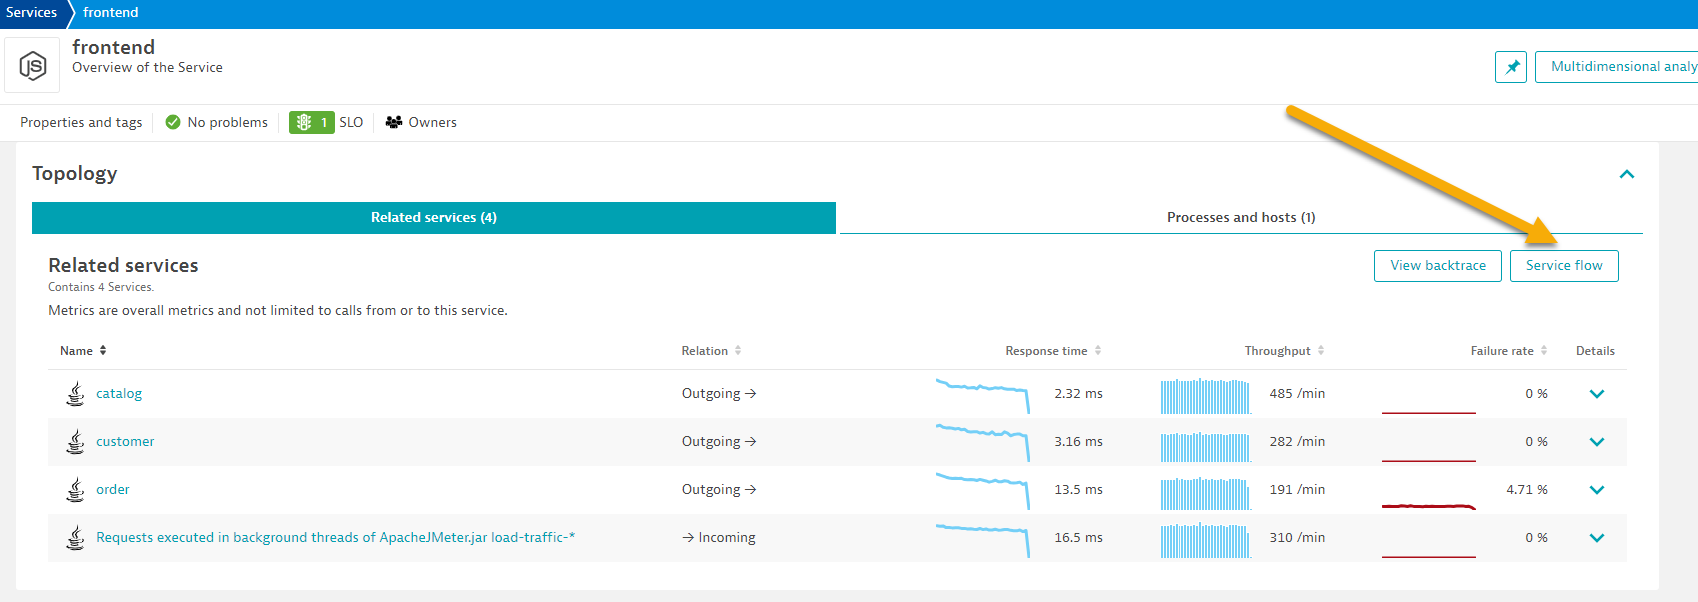
- Left Menu -> Applications & Microservices -> Services
- Analyze Services view from Response time perspective
- You should now be on the Service flow page.
- Right away, we can see how this application is structured:
- Frontend calls order, customer, and catalog service
- Order service calls order and customer service
- Something you would never know from the application web UI!
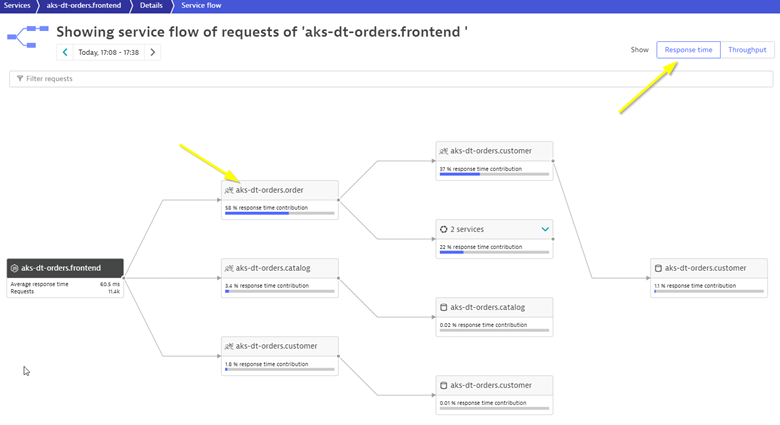
- Refer to the picture above:
- We are viewing the data from a Response time perspective. Shortly, we will review the Throughput perspective.
- Click on the boxes to expand the response time metrics. Most of the response time is spent in the order service and the least in the customer services. And as in the simple version of the application, a very small amount of the response time is spent in the databases.
- Analyze Services view from Throughput perspective
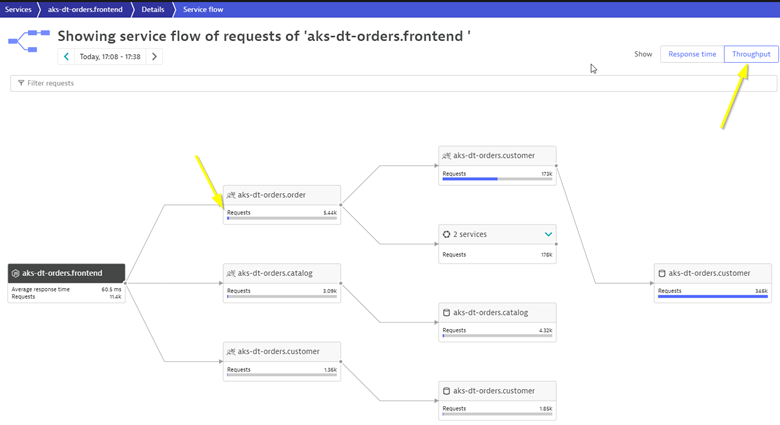
- Refer to the picture above:
- Change to the Throughput perspective by clicking on the box
- Click on the boxes to expand the metrics to see the number of requests and average response times going to each service
- Refer to the picture above:
While migrating to the cloud, you want to evaluate if your migration goes according to the plan, whether the services are still performing well or even better than before, and whether your new architecture is as efficient as the blueprint suggested. Dynatrace helps you validate all these steps automatically, which helps speed up the migration and validation process.
Having the ability to understand service flows enables us to make smarter re-architecture and re-platforming decisions. With support for new technologies like Kubernetes, you have confidence to modernize with a platform that spans the old and the new.
Checklist
In this section, you should have completed the following:
✅ Installed Dynatrace Operator on Azure Kubernetes cluster via Azure Portal
✅ Review real-time data now available for the sample application on Kubernetes
✅ Review Kubernetes dashboards within Dynatrace
✅ Review how Dynatrace helps with modernization planning