In order to do more with less and scale, organizations must transcend IT silos, foster collaboration and improve productivity. Automation and a common data model are key components of this, but it takes platforms that support operational teams and workflows.
With Azure Native Dynatrace Services, our SaaS solution is available as a native azure resource in the Azure Portal. With the native azure resource, we can easily get Azure monitor metrics and azure resource logs without the need of provisioning ActiveGate in your Azure subscription to query the Azure Monitor metrics or setting up Eventhub or Azure functions to forward Azure logs.
🔷 Review how Azure Native Dynatrace integrates and gathers Azure monitor metrics
🔷 Review how Azure monitor metrics can be configured as Metric events for alerts
Referring to the picture below, here are the components for this lab.
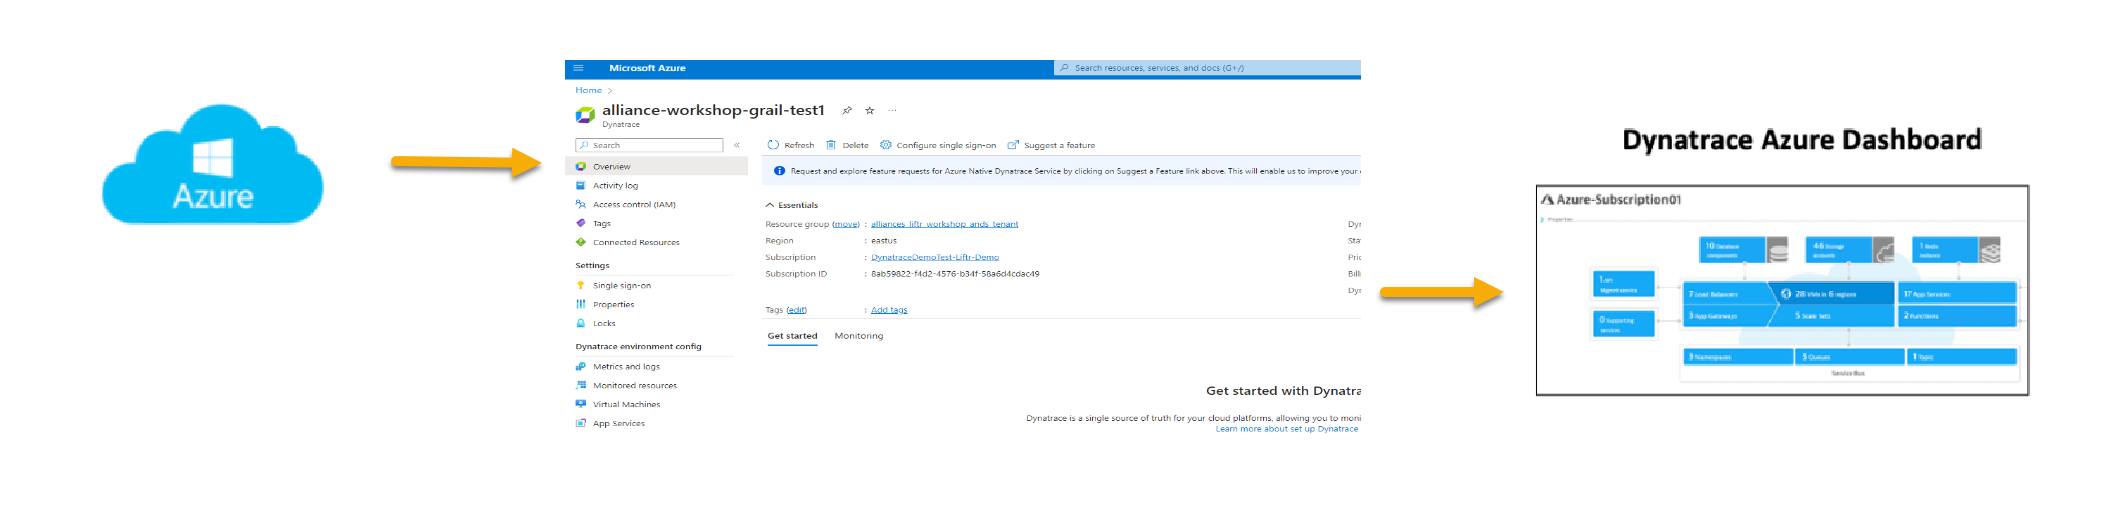
#1 . Azure: Azure cloud platform where Azure services produce metrics that are sent to Azure monitor.
#2 . Azure Native Dynatrace Service: An native Azure resource inside the Azure Portal.
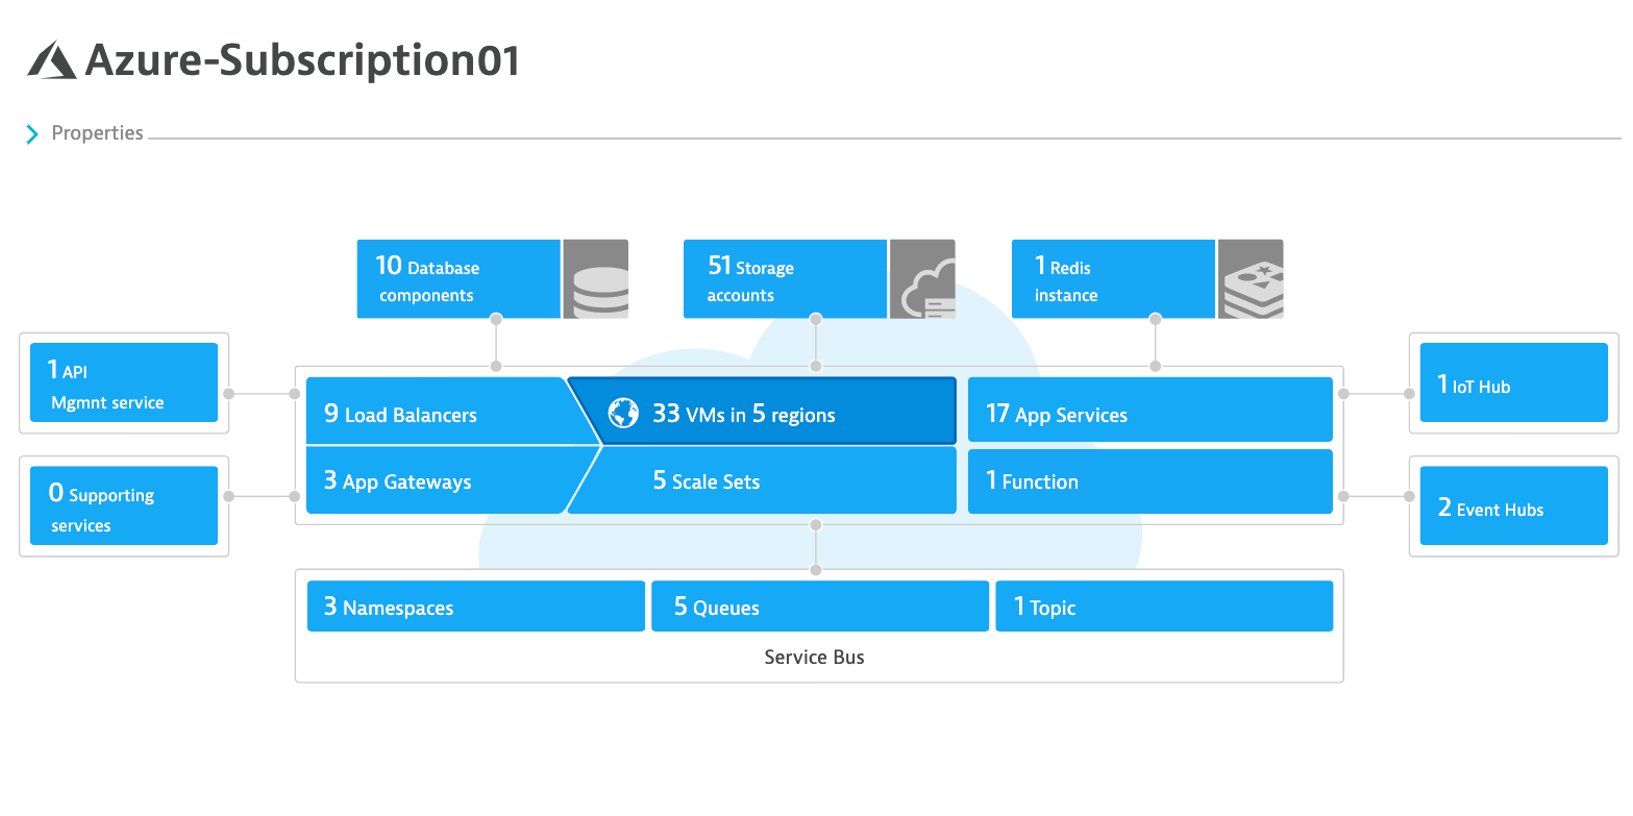
#3 . Dynatrace Azure Dashboard: Out of the box dashboard for each configured Azure subscription.
Azure Dashboard
In addition to monitoring your Azure workloads using OneAgent, Dynatrace provides integration with Azure Monitor which adds infrastructure monitoring to gain insight even into serverless application scenarios.
The integration uses Azure Monitor metrics for service insights, as well as Azure Resource Manager (ARM) to gather metadata.
Review your environment
- From the left side menu in Dynatrace, click the
Azuremenu item. - Scroll down, and in the
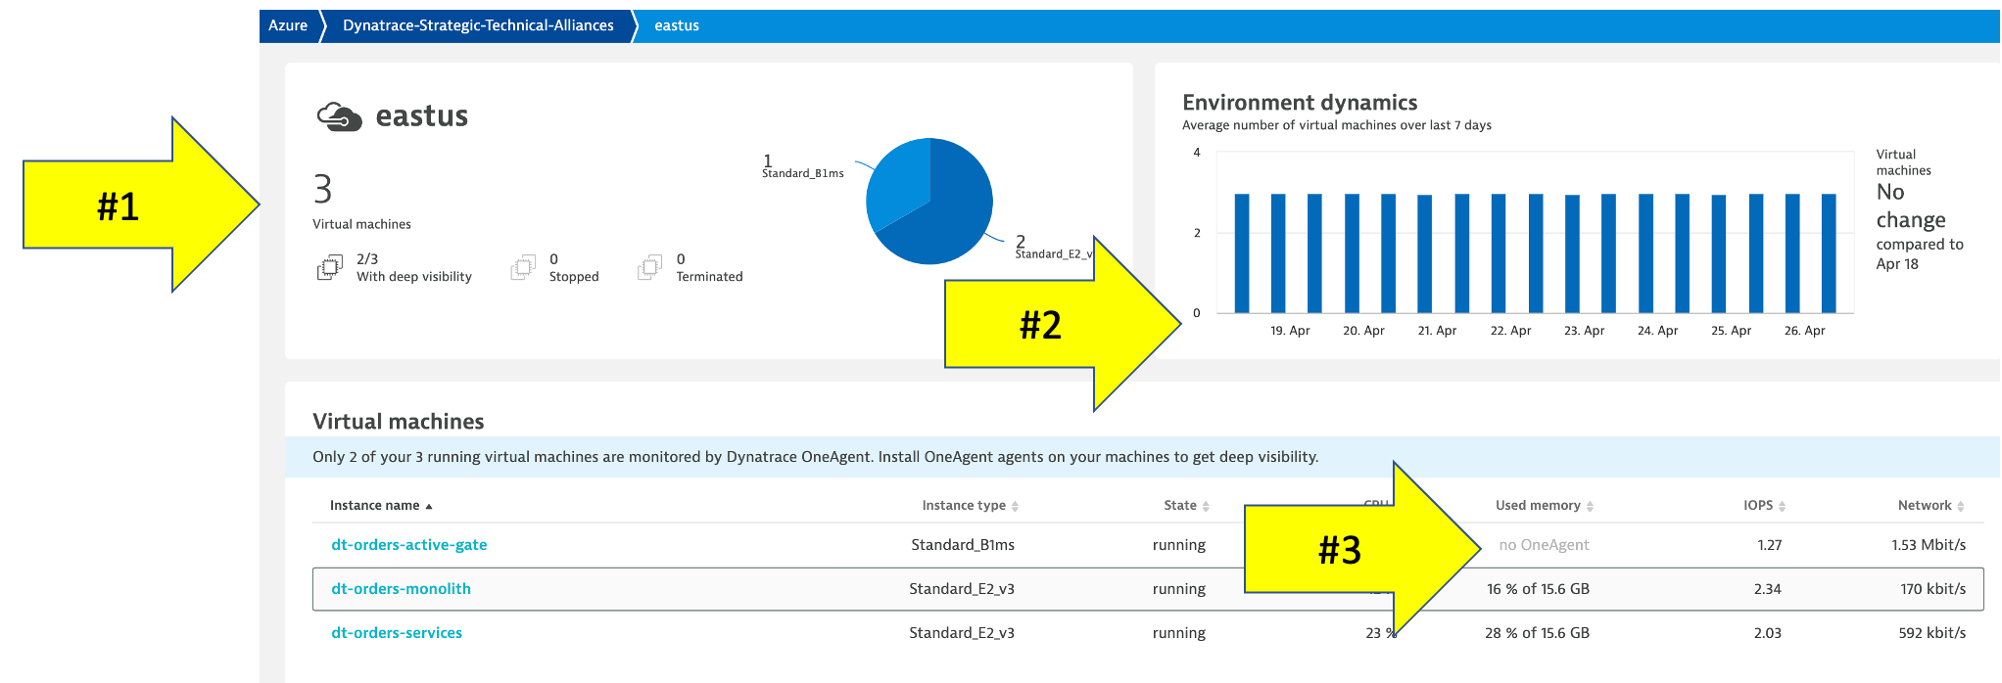
Environment dynamicsaction click on theeastusregion to open the virtual machine regional page
Virtual machine regional page
Notice the following details:
- A summary of type and status is shown
- A running average for virtual machines
- A table of host with Azure monitor metrics summarized. Notice that both VMs with and without an OneAgent are both shown
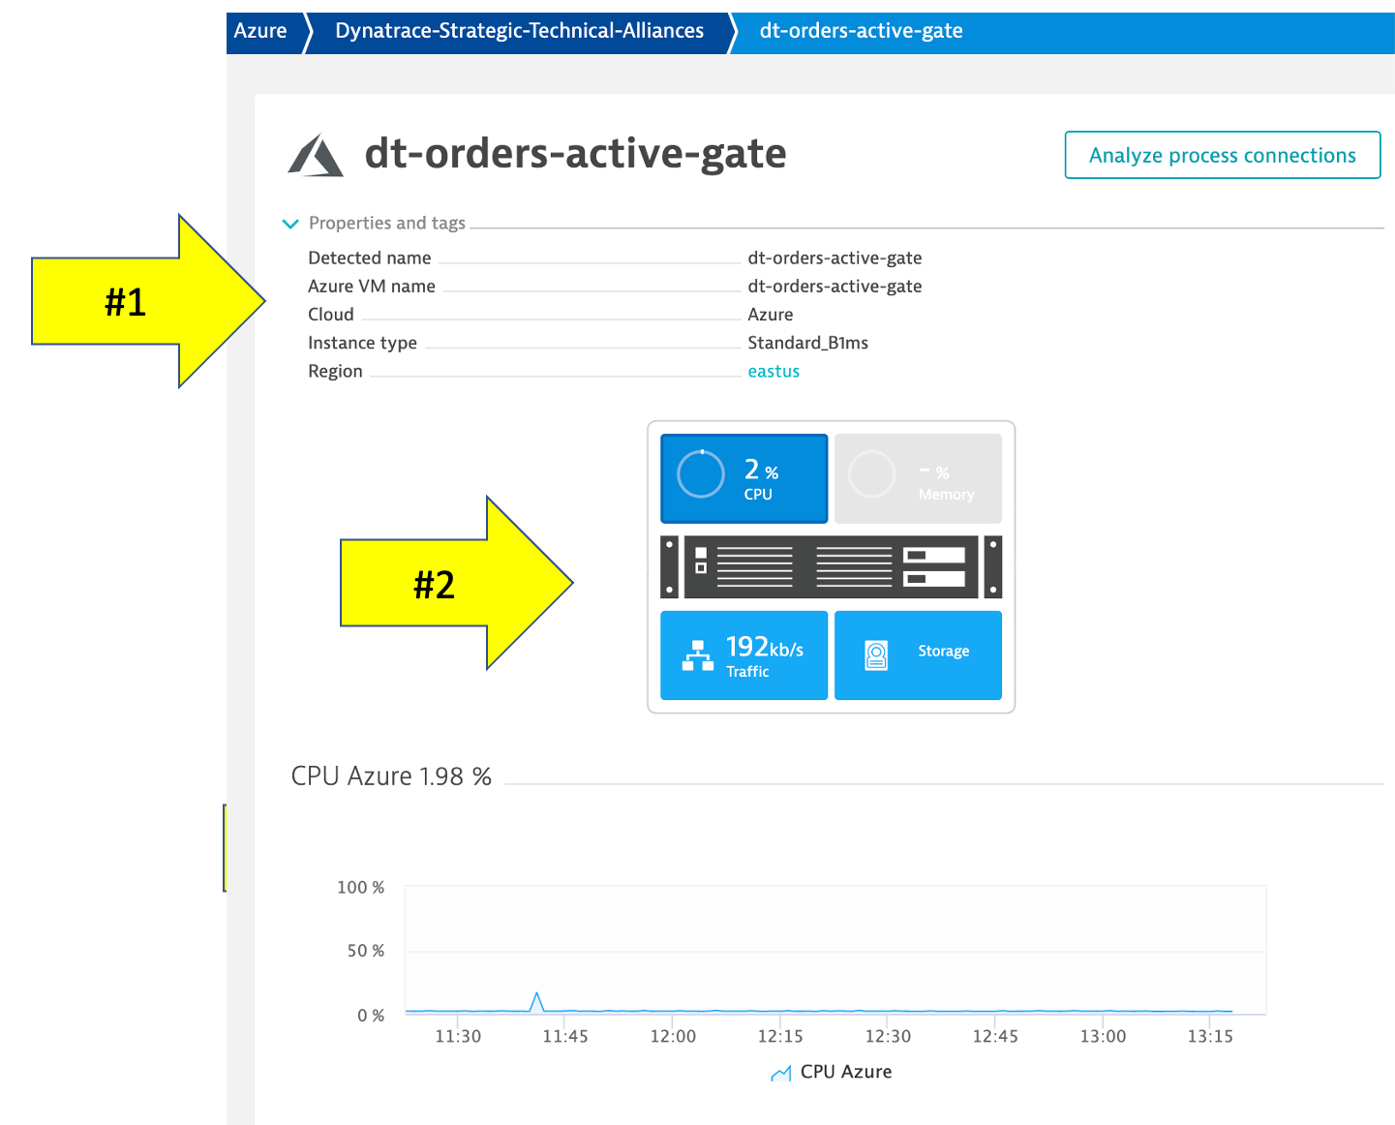
Virtual machine details
Click on the dt-orders-active-gate host to open the host page.
Notice the following details:
- Expand the properties to see more details
- All the Azure monitor metrics are viewable as time-series data
The Dynatrace Clouds app, a novel way for observing multiple resources across multiple clouds. It provides a single, centralized dashboard that displays all resources across multiple clouds, and significantly enhances multicloud resource tracking and governance.
The Clouds App provides: - Centralized oversight and insights: A univied view that elimiates the to switch between different cloud services dashboards. - Logs and metrics in context: With a single click, the dashboard shows an analysis of logs and metrics for a selected resource in its appropriate context, making it easier to understand the complexities inherent in cloud infrastructure. - Enhanced troubleshooting: Troubleshooting is more effective when teams can see patterns and anomalies across all cloud environments, rather than analyzing them in isolation.
Check out this blog for additional use cases. Also here's a link to the docs
Tasks to complete this step
- In Dynatrace from menu on the left, select
Apps -> Clouds. - Click on All Services and select the Azure VM called
dt-orders-monolithto view the metrics for that VM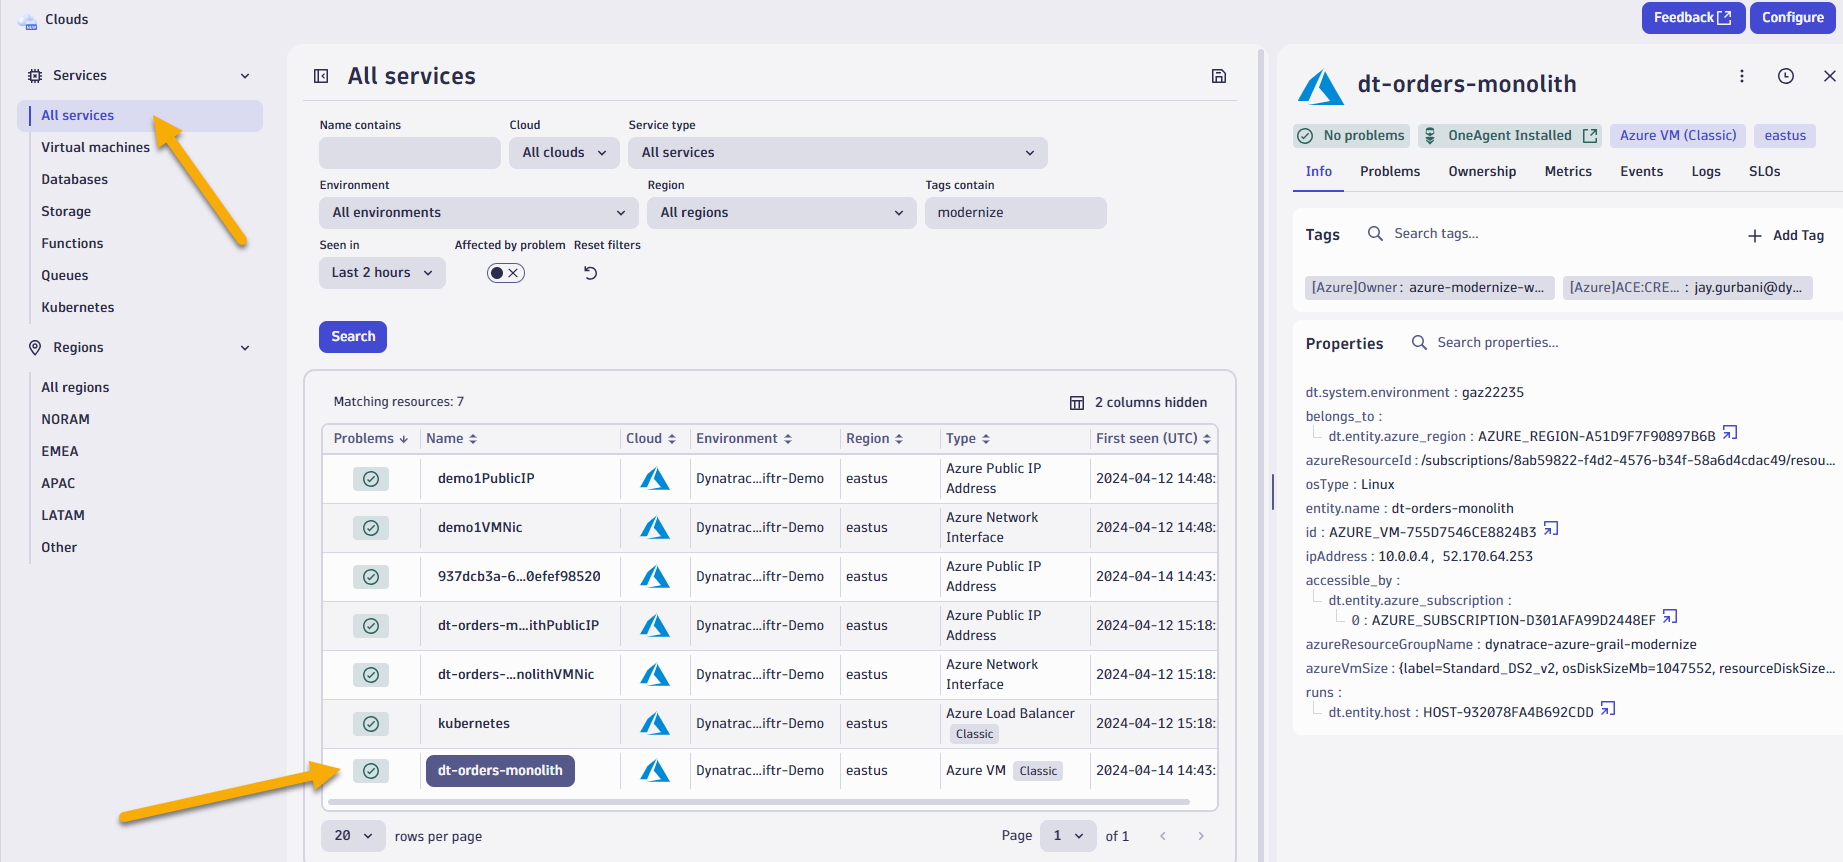
- Click on Metrics, and Logs tab to quickly access the details for that service.
- Also, if there'an open problem against this host, you can quickly view the problem details on
Problemstab.
- Select another service such as the
KubernetesAzure Load Balancer service- Notice all the properties we bring in for this service including the Azure tags
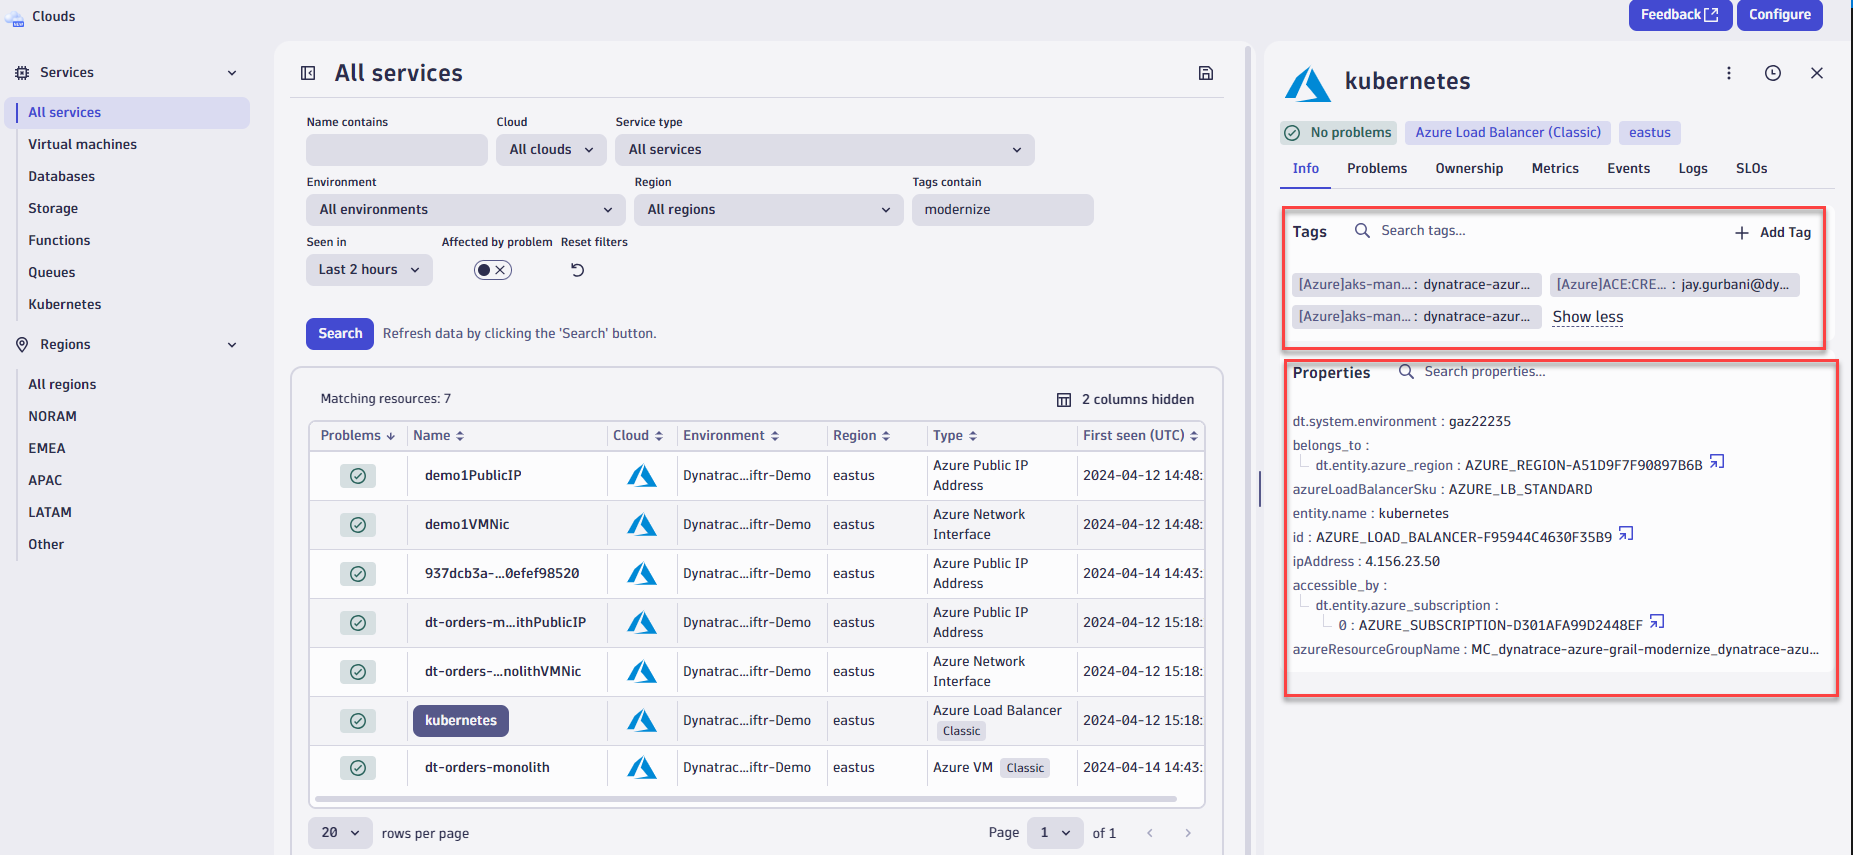
- Notice all the properties we bring in for this service including the Azure tags
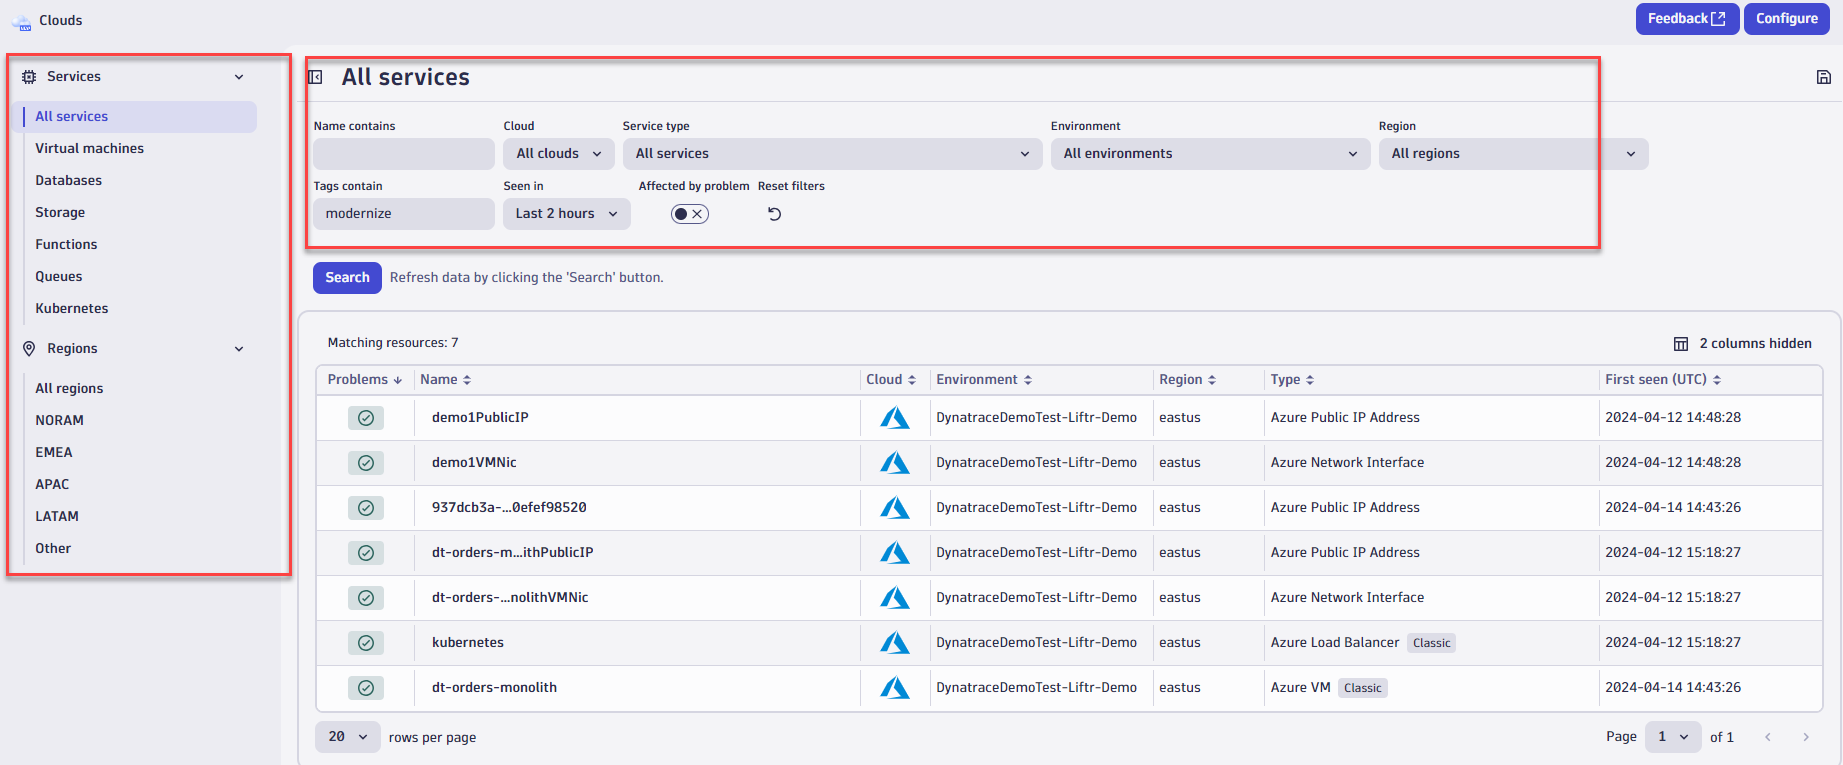
- Notice all of the other ways you can filter the cloud services by service type, regions, or service names, clouds, etc to look for details on specific metric.
Dynatrace Davis automatically analyzes abnormal situations within your IT infrastructure and attempts to identify any relevant impact and root cause. Davis relies on a wide spectrum of information sources, such as a transactional view of your services and applications, as well as on events raised on individual nodes within your Smartscape topology.
There are two main sources for single events in Dynatrace:
- Metric-based events (events that are triggered by a series of measurements) and events that are independent of any metric (for example, process crashes, deployment changes, and VM motion events)
- Custom metric events are configured in the global settings of your environment and are visible to all Dynatrace users in your environment.
Tasks to complete this step
- Setup Custom Metric Events for Alerting
- To add custom alerts, navigate to
Settings --> Anomaly Detection --> Metric Eventsmenu. - Click the
Add metric Eventbutton.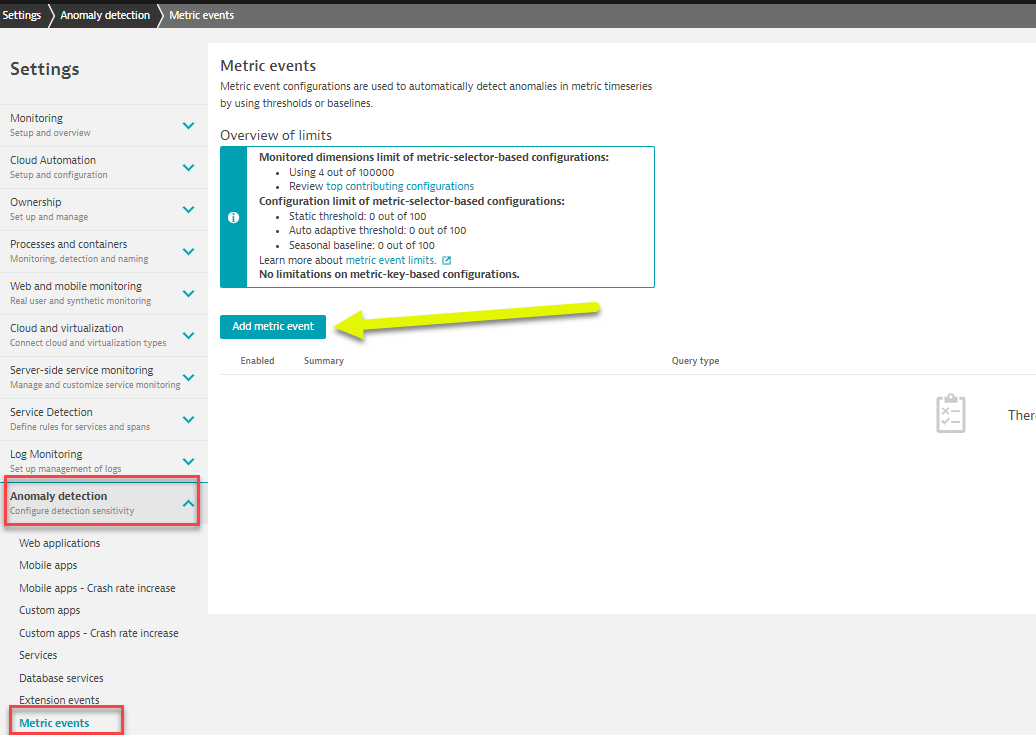
- Fill in the below information on the
Add metric eventtemplate- Summary:
CPU % percentage - Type:
Metric keyfrom dropdown - Metric key
Azure CPU usagefrom dropdown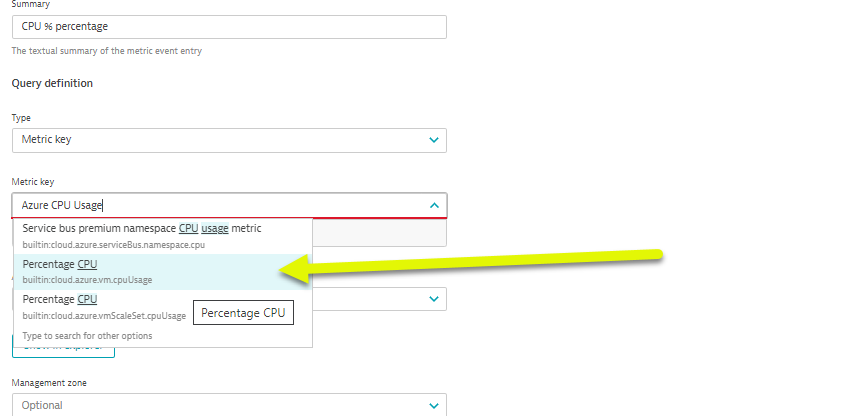
- Agregation
Averagefrom dropdown - Management zone
dt-orders-monolith - under
Entitiesclick on>to seeAdvanced dimension definitionand selectAzure VMfrom dropdown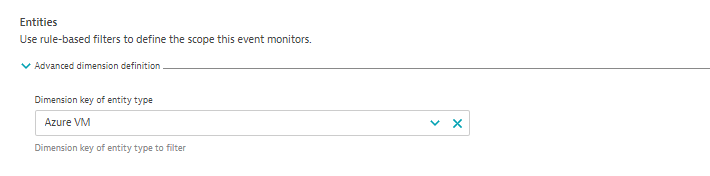
- Dimension filter click on
Add dimension filterand select as shown below.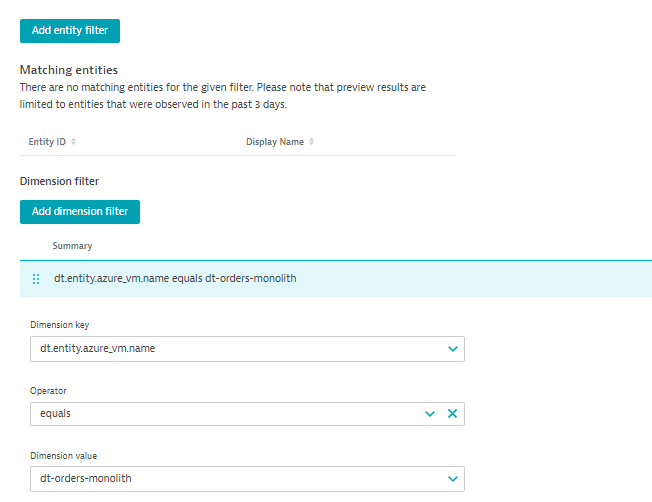
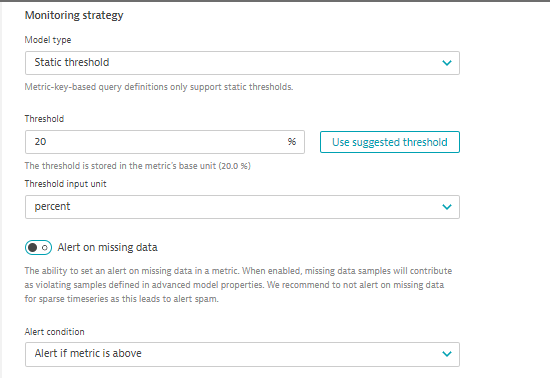
- under Monitoring strategy section select as shown.
- select the
>next toAdvanced model propertiesand input as shown.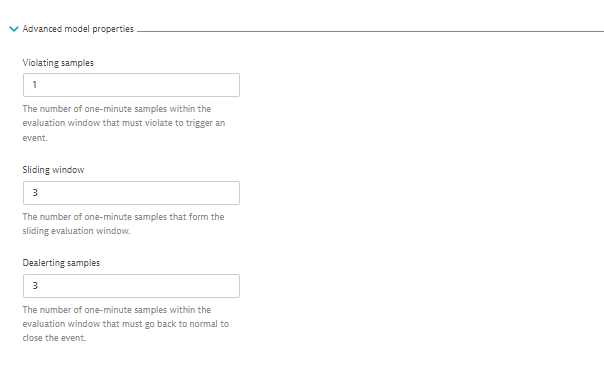
- In the
Event templatesection add:- Title:
CPU CUSTOM ALERT - Event type from dropdown:
Custom alert - Dimension key of entity for events select
Azure VMfrom dropdown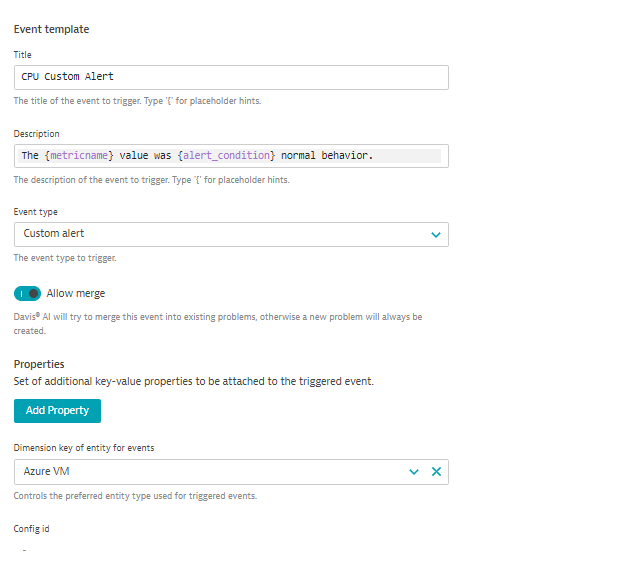
- Title:
- click on
Save Changes
- Summary:
- Add another rule, with everything the same, except for the Event Description to have the title as
CPU Resource Alertand Event type =RESOURCEas shown below.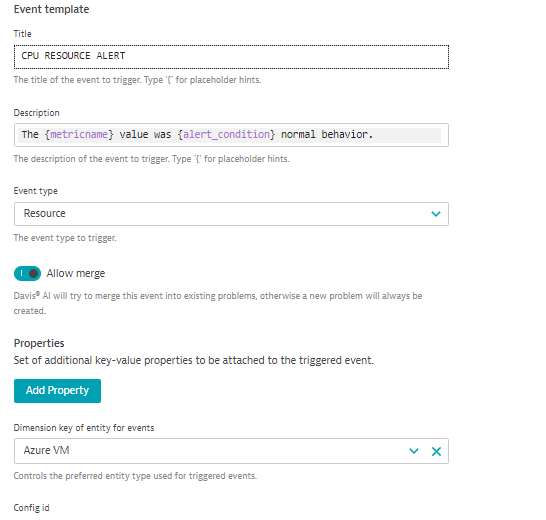
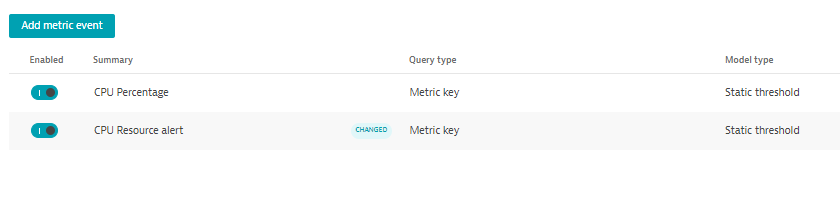
- Save your changes and the list should look as shown below.
- To add custom alerts, navigate to
Tasks to complete this step
- Trigger a CPU Problem
- To enable a problem, you will go into the Azure Portal UI and use the
Run Commandfeature to start a shell script. - From the Azure Portal, search for
dt-orders-monlithVM from the search menu and select it.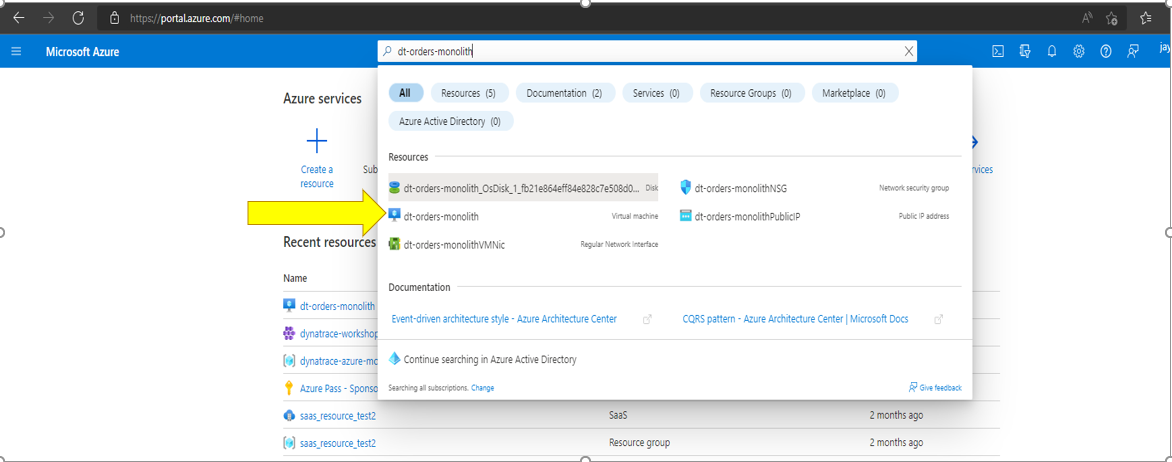
- Once inside the VM resource page, click on
Run Commandunder Operations from the left menu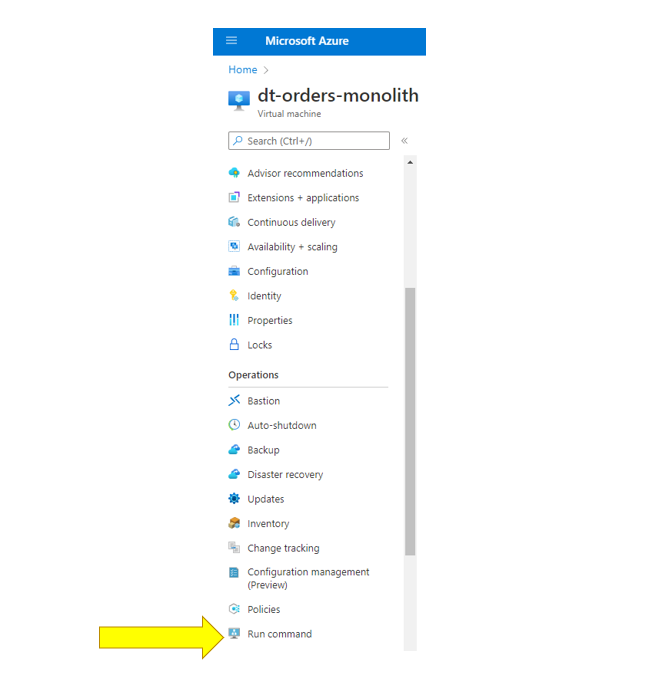
- Next, click on
RunShellScriptand type in the command listed below in theRun Command Scriptwindow and click run/home/workshop/azure-modernization-dt-orders-setup/learner-scripts/run-cpu-prb.sh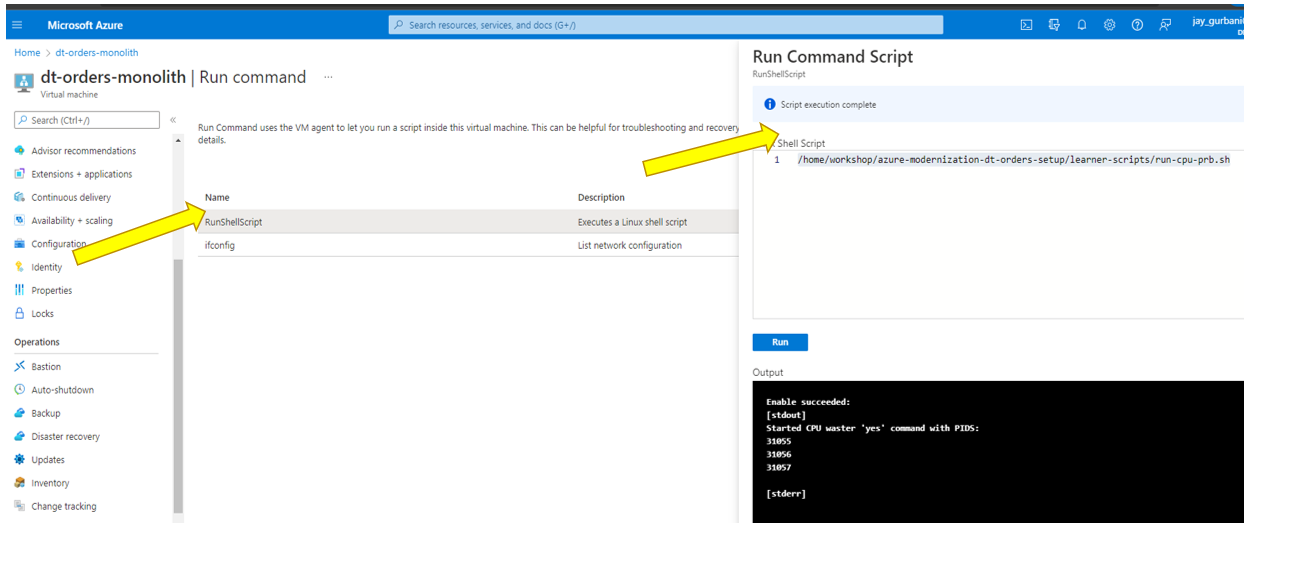
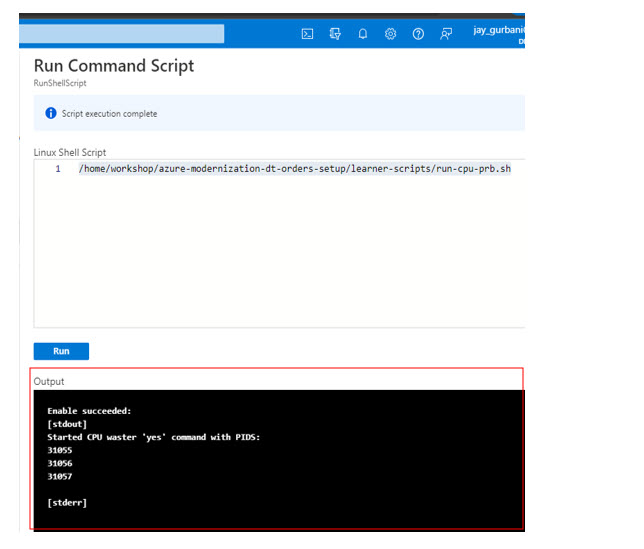
- In the output window you should receive the following:
- To enable a problem, you will go into the Azure Portal UI and use the
- Review Dynatrace UI for Problem card
- Back in Dynatrace within the
Hosts Classicapp, the CPU should now be high as shown below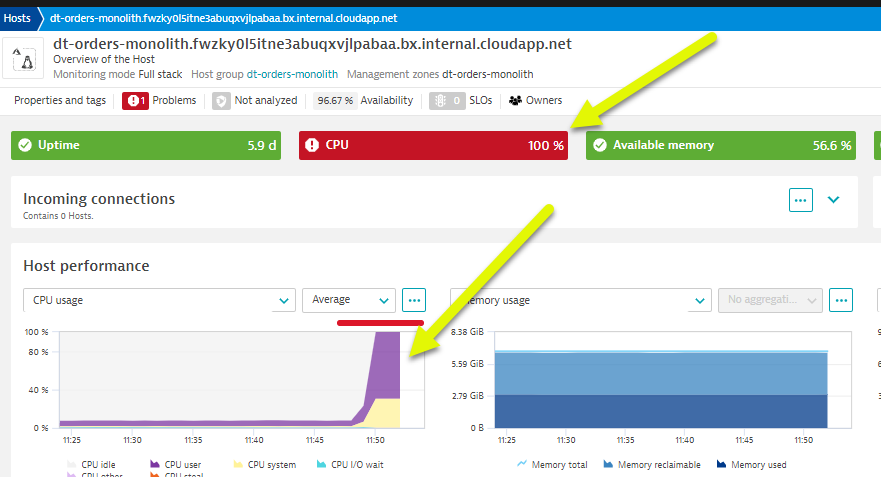
- It may take a minute or so, but you will get two problem cards as shown below. #1 is the alert from the
severity = RESOURCEwhere Davis was invoked, and #2 is the alert fromseverity = CUSTOM ALERT.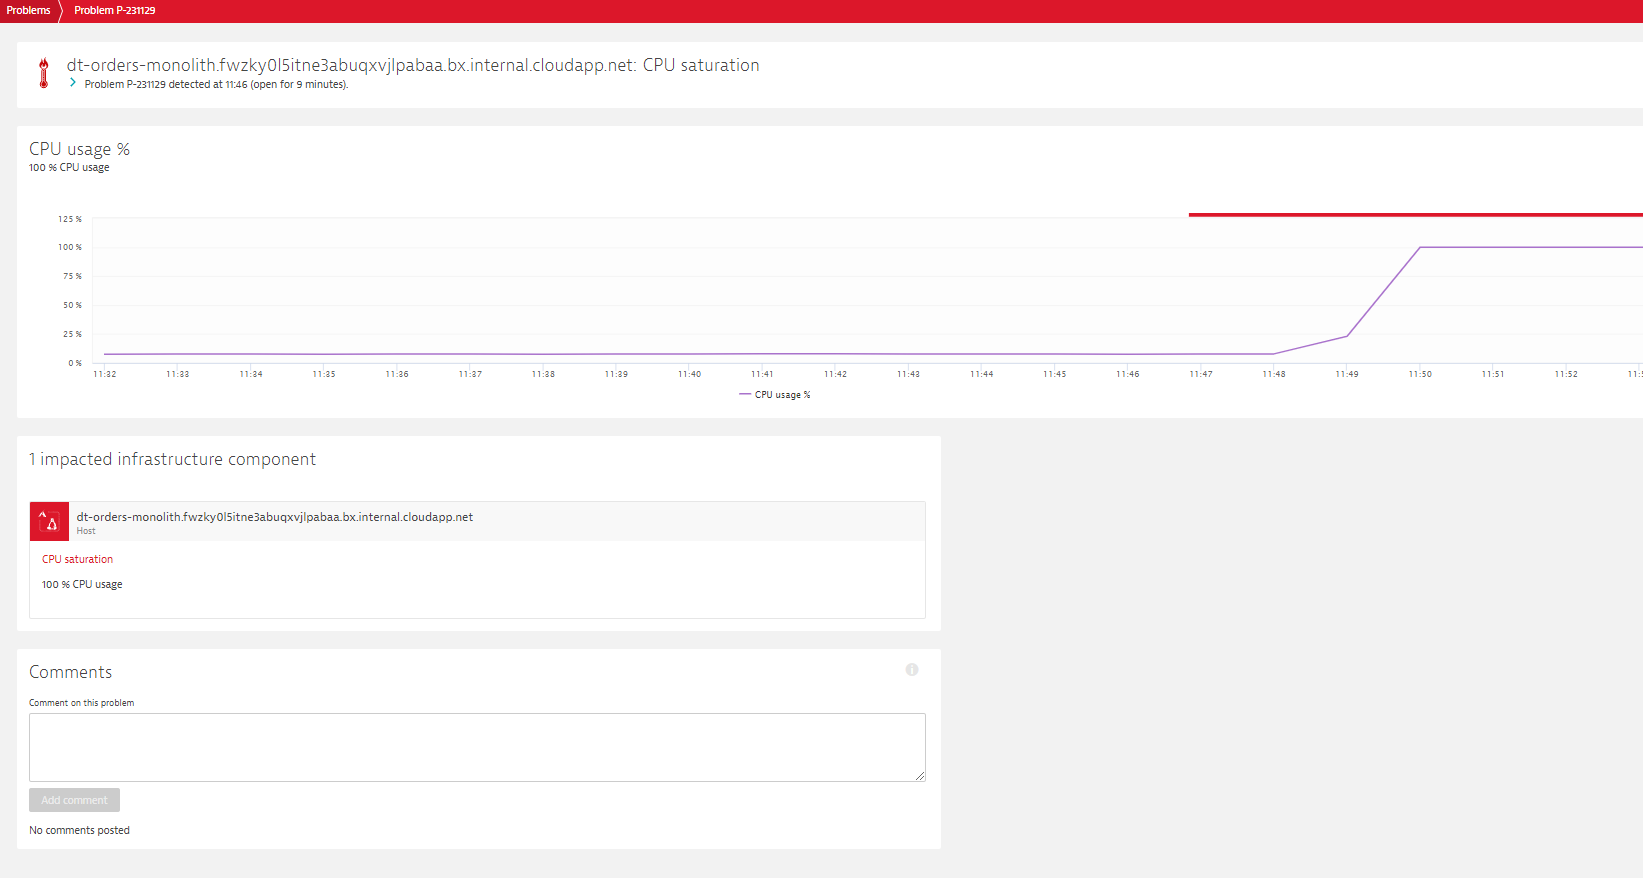
- Review Problem Notifications Settings
- Navigate to
Settings --> Integrations --> Problem Notifications - Read the overview and then click the
Add Notificationbutton - Click various
Notification typesfrom the drop down to review the configurations inputs. - For the
Custom integrationtype, review the option to customize the payload. - Notice how you can choose the
Alert profile, but you only have default as an option currently
- Navigate to
- Review Alerting Profiles
- Navigate to
Settings --> Alerting --> Alerting profiles - Read the overview and then expand the
defaultrule. - Now add one, by clicking on the
Add alerting profilebutton - Review the options to choose severity rules and filters
- Navigate to
- Back in Dynatrace within the
- Stop the CPU problem
- To stop the problem, we will use the same
Run Commandfeature in Azure Portal to execute stop shell script. - From the Azure Portal, search for
dt-orders-monlithVM from the search menu and select it. - Once inside the VM resource page, click on
Run Commandunder Operations from the left menu - Next, click on
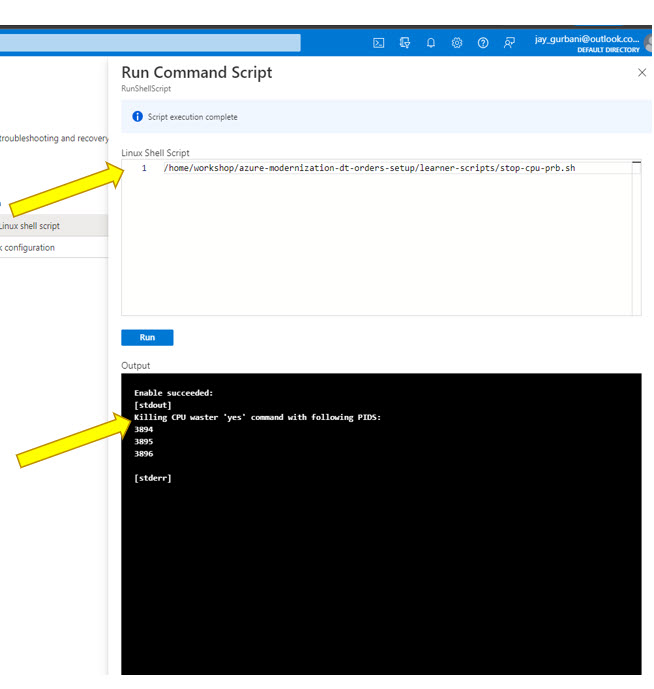
RunShellScriptand type in the following command listed below in theRun Command Scriptwindow and click run/home/workshop/azure-modernization-dt-orders-setup/learner-scripts/stop-cpu-prb.sh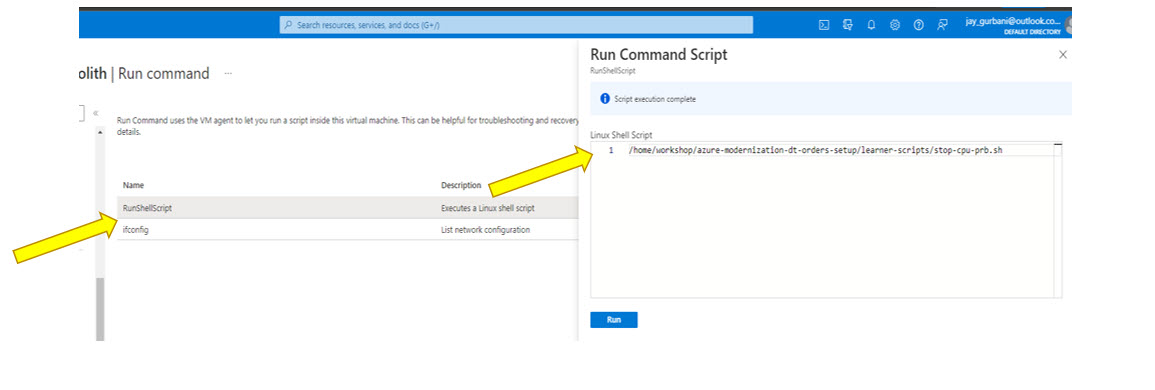
- In the output window you should receive the following:
- Verify that CPU in Dynatrace goes to normal and the problem card will automatically close
- To stop the problem, we will use the same
In this section, you should have completed the following:
✅ Reviewed how Dynatrace integrates with Azure monitor
✅ Reviewed how Azure monitor metrics can be configured as Metric events for alerts