Overview
Often the monitoring tools organizations use simply don't work in the complex ecosystem of microservices and for technologies like Kubernetes.
Finding the root cause of problems is harder than ever before and the effort required goes beyond what is humanly possible when the application spans to the cloud providers and data centers and the explosion of interconnected services. There are more possibilities for failures and more hiding spots for problems to sneak into the environment when software driving more than just the application.
In this lab, we will trigger a few problem and see how troubleshooting time is Significantly reduced by letting AI automatically detect problems and pinpoints the root cause, explaining business impact with no manual configurations.
Objectives of this Lab
🔷 Enable a problem in the application and walk through what Dynatrace Davis found
🔷 Review how Dynatrace process events and Tags to provide additional context in root cause analysis
Before we get to the problems, let's review Dynatrace Information Events.
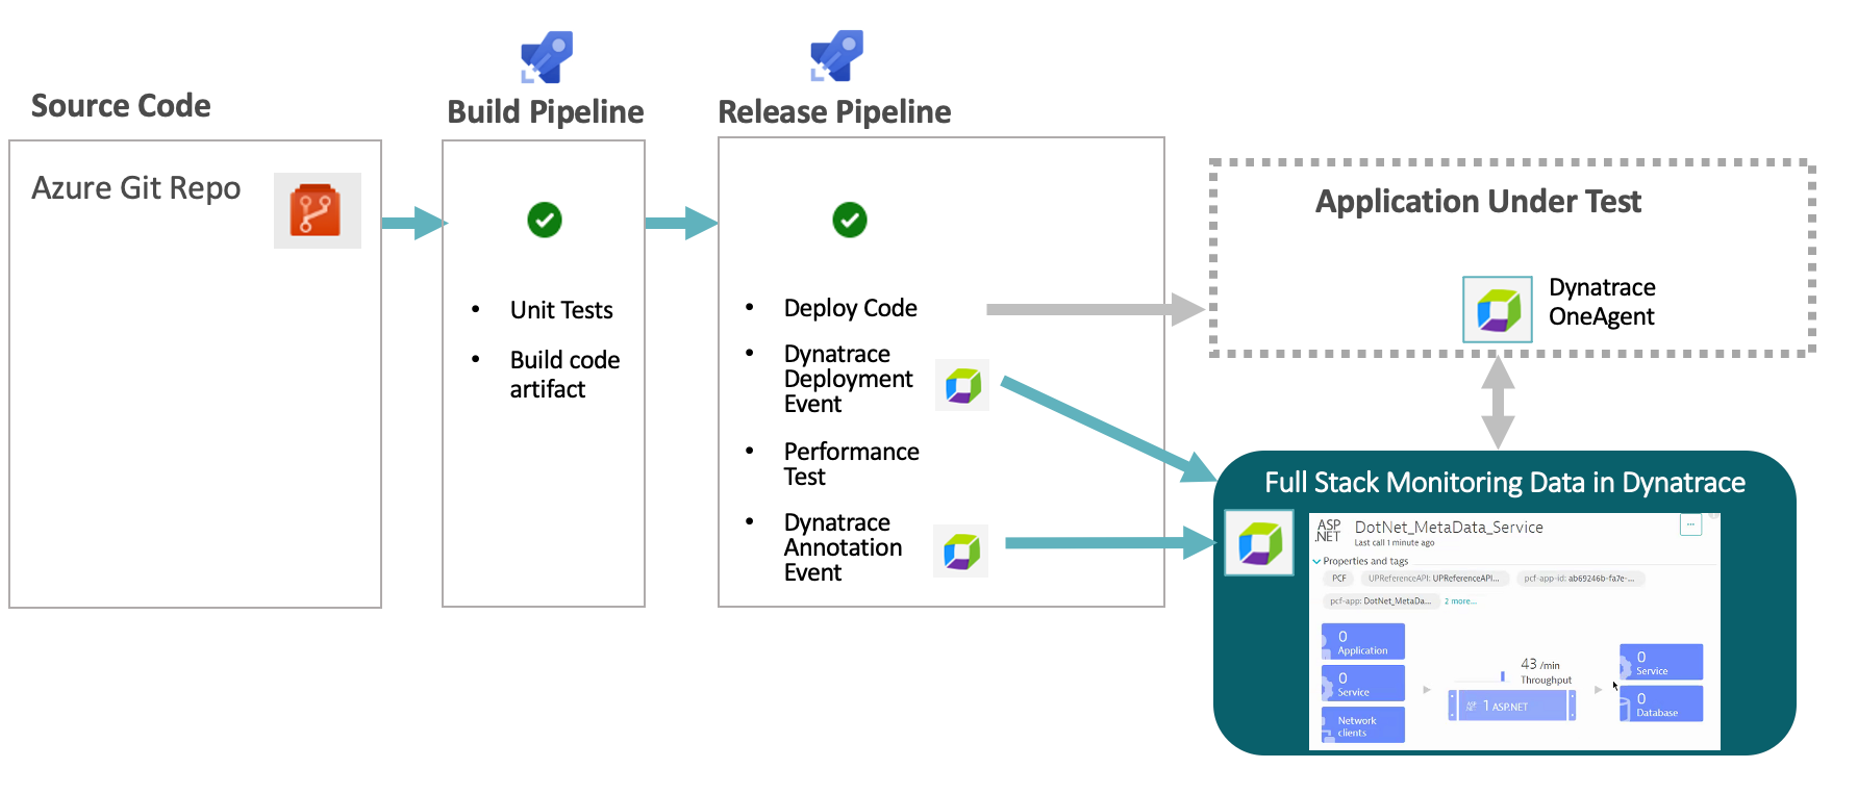
Dynatrace information events enable continuous delivery tools, such as Azure DevOps, to provide additional details for Dynatrace. Here is an example of two informational events for deployment and performance testing being be sent to Dynatrace.
There are several Dynatrace information event types:
- CUSTOM_ANNOTATION
- CUSTOM_CONFIGURATION
- CUSTOM_DEPLOYMENT
- CUSTOM_INFO
- MARKED_FOR_TERMINATION
Below we can see both the CUSTOM_INFO (#1) and CUSTOM_DEPLOYMENT events (#2) for a service that was the root cause to a problem the Dynatrace AI engine, Davis®, determined.
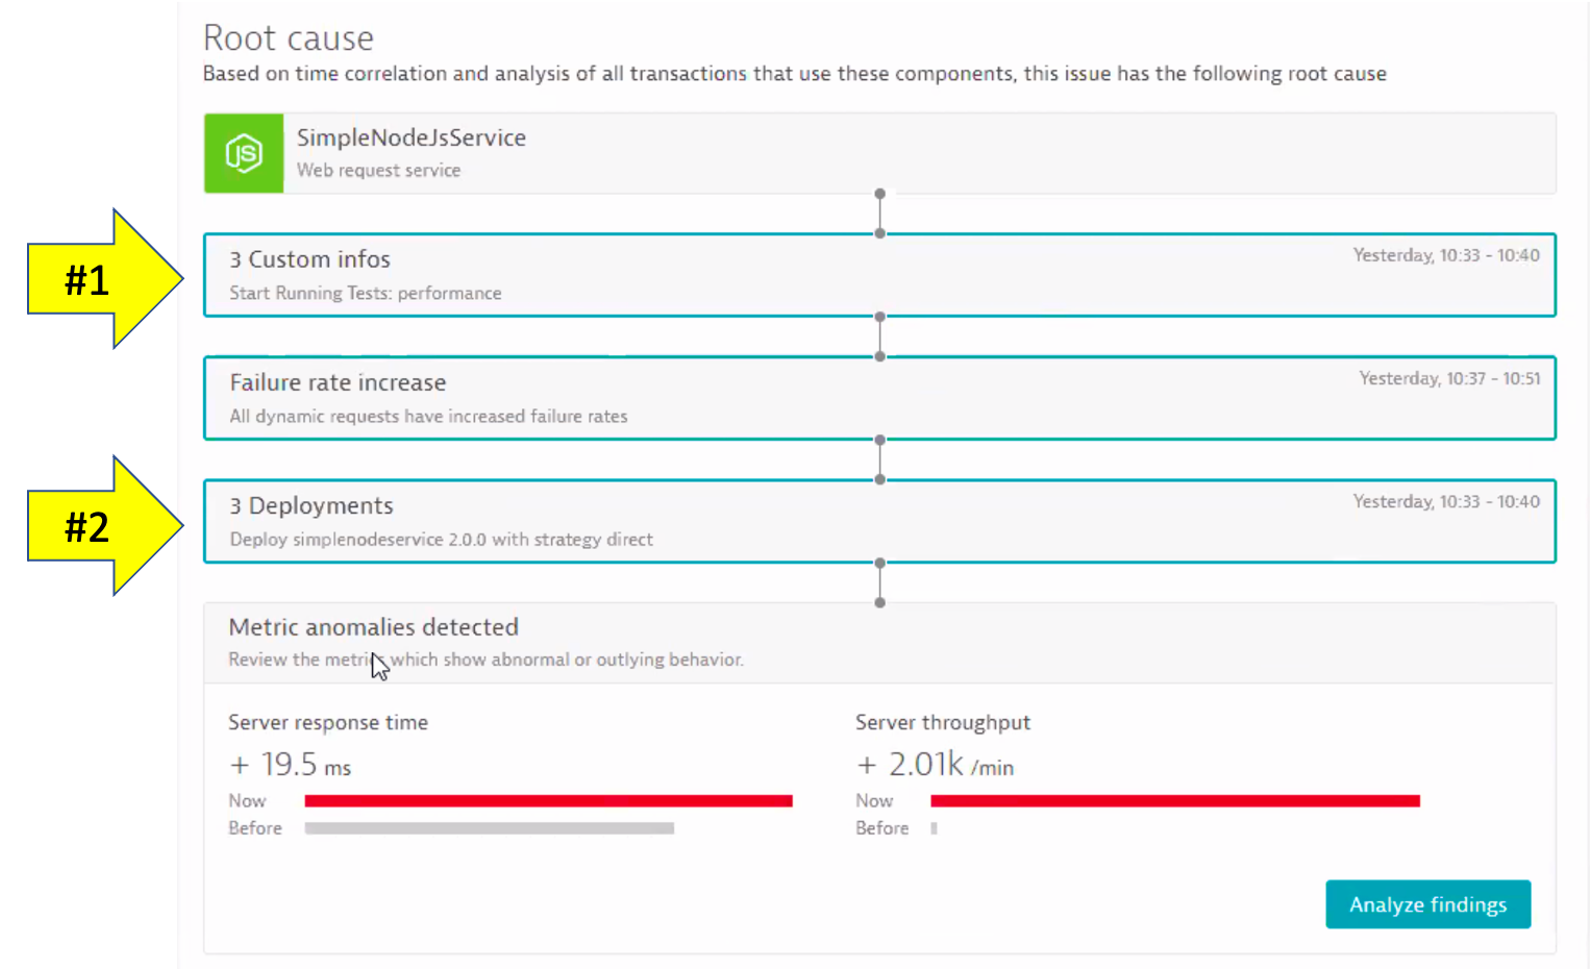
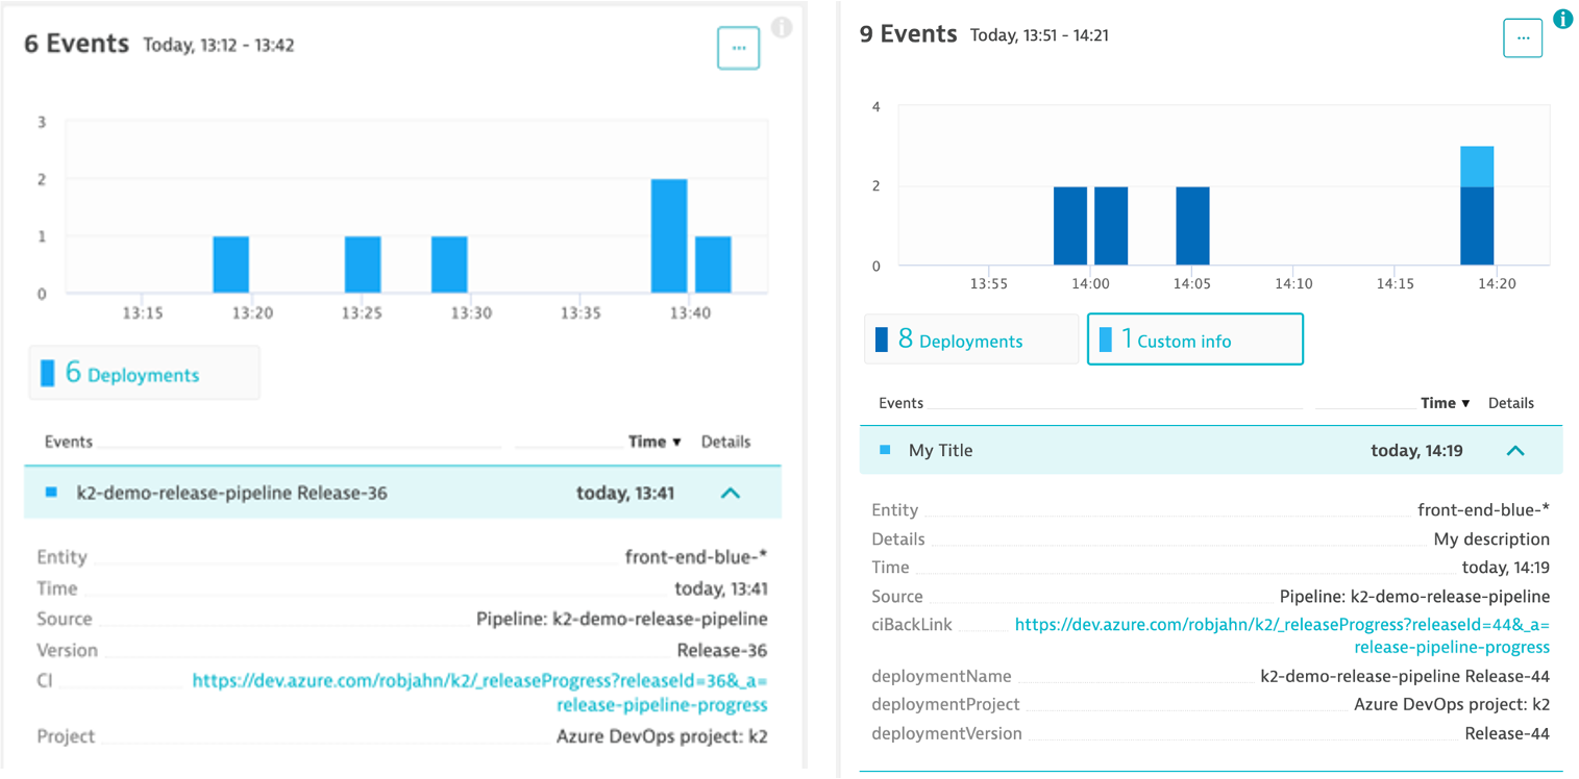
Each event has a timestamp, event source, a few standardized fields (depending on the event type), and the option to add additional custom fields. See this table for details. Here are two example events. NOTE: the URL back to the pipeline making the change.
Dynatrace tags
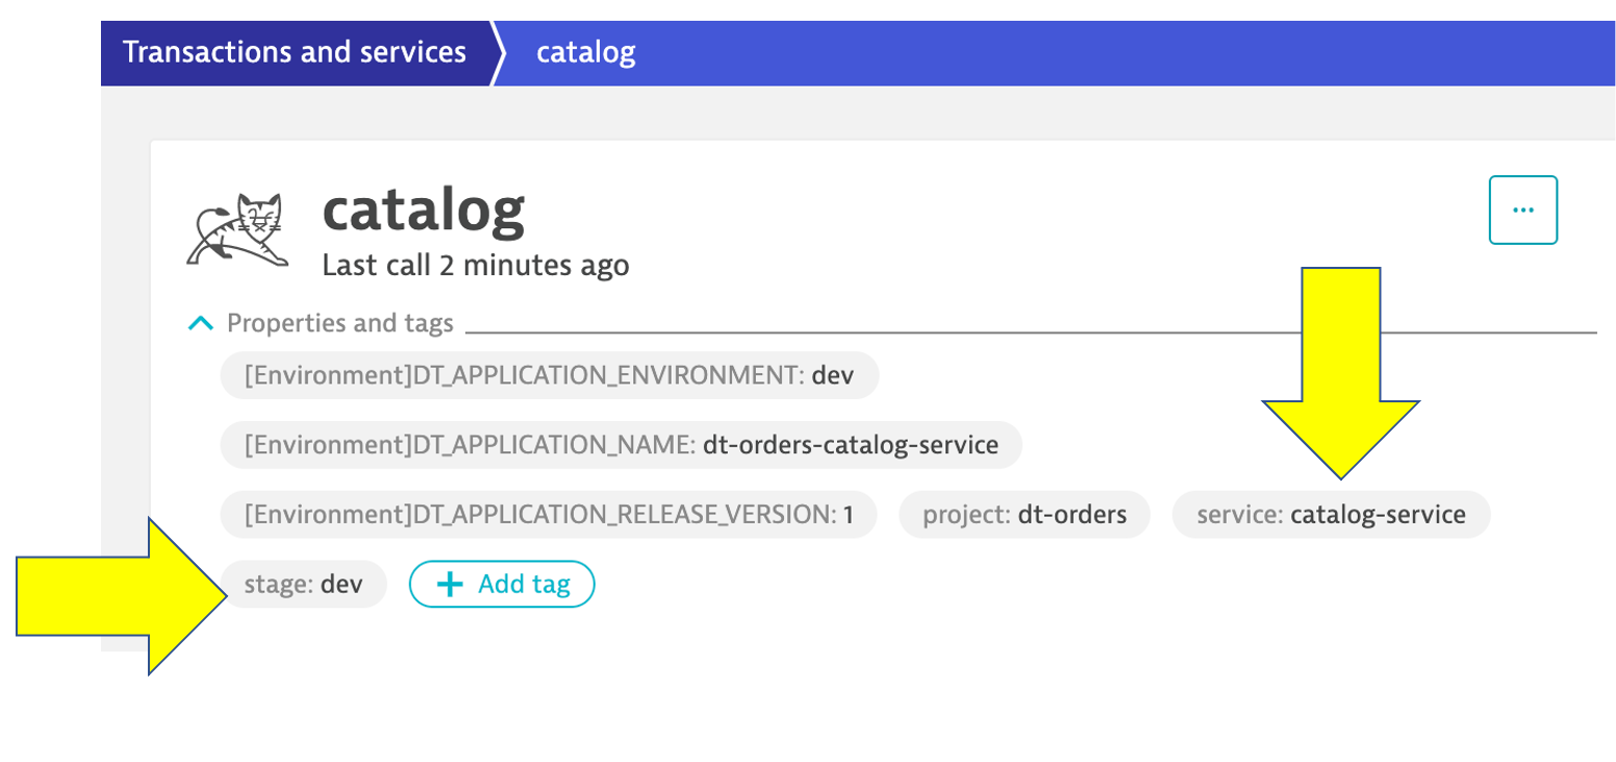
When creating information events, you must target the entities to receive the event so that it's only associated with the relevant component. That is where Dynatrace tags come in.
In a nutshell, tags in Dynatrace are labels or markers used for organizing entities in large monitoring environments. Below shows a few tags for my catalog service: stage:staging and service:catalog-service
API call Example
Here is an example of a typical events API call. You do not need to executed this as you will see this in action as part of the scripts in the next step
curl -X POST \
  https://mySampleEnv.live.dynatrace.com/api/v2/events/ingest\
  -H 'Authorization: Api-token abcdefjhij1234567890' \
  -H 'Content-Type: application/json' \
  -d '{
  "eventType": "CUSTOM_ANNOTATION",
  "timeoutMinutes": 0,
  "attachRules": {

    "tagRule": [
      {
        "meTypes": [
          "CUSTOM_DEVICE"
        ],
        "tags": [
          {
            "context": "CONTEXTLESS",
            "key": "IG-test"
          }
        ]
      }
    ]
  },
  "source": "OpsControl",
  "annotationType": "defect",
  "annotationDescription": "coffee machine is defective"
}'
In this step we are going to "simulate" a deployment of new version of the backend service. After the "deployment" the service will exhibit a high response time for all backend requests.
Tasks to complete this step
- To enable the problem pattern, use the unix that is provided that will do the following
- Call the
backend/set-versionURL set the backend version - Send a Dynatrace
CUSTOM_DEPLOYMENTevent indicating the change - From the Azure shell, run these commands to set the version:
cd ~/azure-modernization-dt-orders-setup/learner-scripts ./set-version.sh backend 2 - Review the output to ensure the change was made successfully. I should look like this with numerical values at the end for
Response Data: storedEventIds:@Azure:~/azure-modernization-dt-orders-setup/learner-scripts$ ./set-version.sh backend 2 Retrieving dt-orders-monolith Public IP ================================================================= Setting Service Version SERVICE = backend NEW_VERSION = 2 SET_VERSION_URL = http://1.1.1.1/backend/setversion/2 ================================================================= Set backend to 2 was successful ================================================================= Sending Dynatrace Deployment event DT_API_URL = https://xxx.live.dynatrace.com/api/v1/events DEPLOYMENT_NAME = Set backend to version 2 DEPLOYMENT_VERSION = 2 DEPLOYMENT_PROJECT = dt-orders CI_BACK_LINK = http://1.1.1.1 ================================================================= Push Event POST_DATA { "eventType" : "CUSTOM_DEPLOYMENT", "source" : "Custom Unix Shell Script" , "deploymentName" : "Set backend to version 2", "deploymentVersion" : "2" , "deploymentProject" :"dt-orders" , "ciBackLink" : "http://1.1.1.1", "customProperties": { "Example Custom Property 1" : "Example Custom Value 1", "Example Custom Property 2" : "Example Custom Value 2", "Example Custom Property 3" : "Example Custom Value 3" }, "attachRules" : { "tagRule" : [ { "meTypes":["PROCESS_GROUP_INSTANCE"], "tags": [ { "context": "CONTEXTLESS", "key": "service", "value": "backend" }, { "context": "CONTEXTLESS", "key": "project", "value": "dt-orders" }, { "context": "CONTEXTLESS", "key": "stage", "value": "production" } ]} ]} } } Response Data {"storedEventIds":[8663164135574257870,-5988376401319068441],"storedIds":["8663164135574257870_1628095127627","-5988376401319068441_1628095127627"],"storedCorrelationIds":[]}
- Call the
- Validate Sample App in Browser
- The output from previous task has link to the sample under
CI_BACK_LINK. Click on the URL to get to the sample application if you don't have the sample app up already. You should seeversion 2for the customer app now too.
- The output from previous task has link to the sample under
- Review the Problem card in Dynatrace
- Go to Dynatrace menu -> Problems, and you will probably see two problems that eventually get merged...
- Impact summary - multiple service impact
- Root cause
- Click on the
Analyze Response Time Degradationbutton to view the real issue with the request.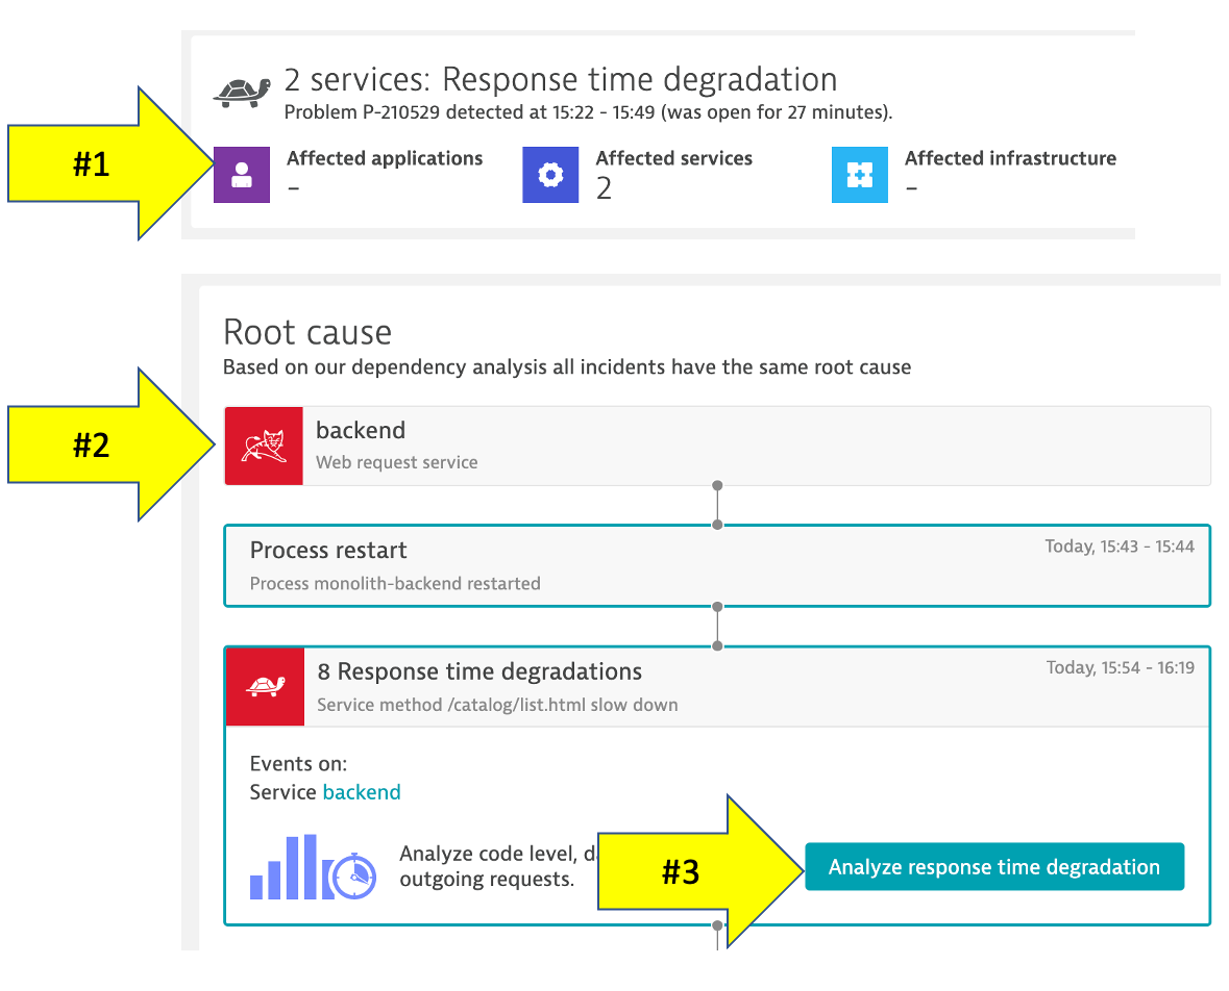
- Go to Dynatrace menu -> Problems, and you will probably see two problems that eventually get merged...
- Analyze problem - top findings
- Here you can see how Dynatrace automatically analyzes the problem and lets you know whether the problem is related to code, waiting, or other services and queues.
- Click in the
code executionline with the top findings to open the execution time breakdown detail.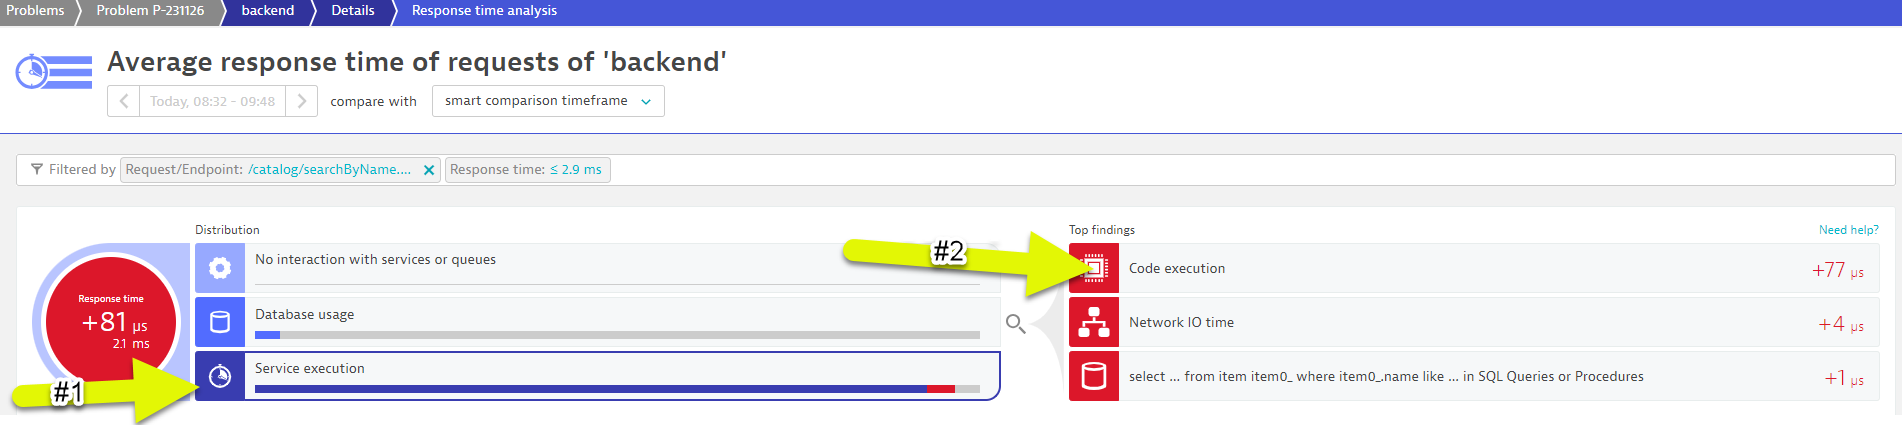
- Analyze problem - execution time breakdown
- Dynatrace automatically shows the breakdown of the execution time. To see more, click the
View method hotspotsbutton.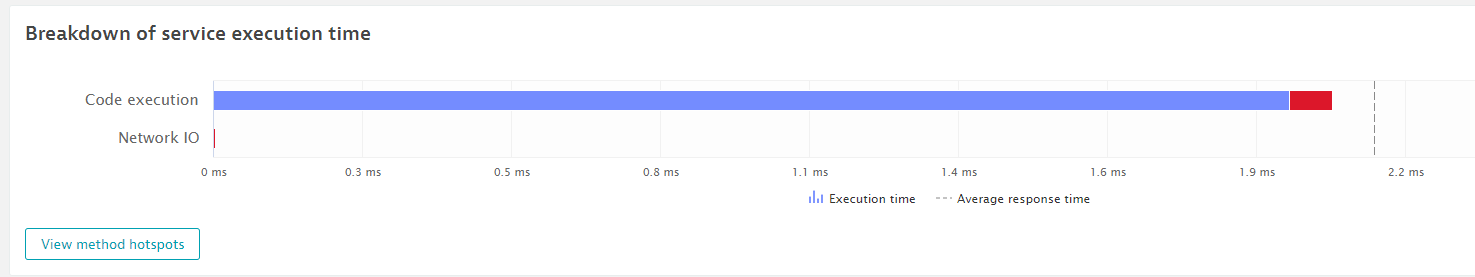
- Dynatrace automatically shows the breakdown of the execution time. To see more, click the
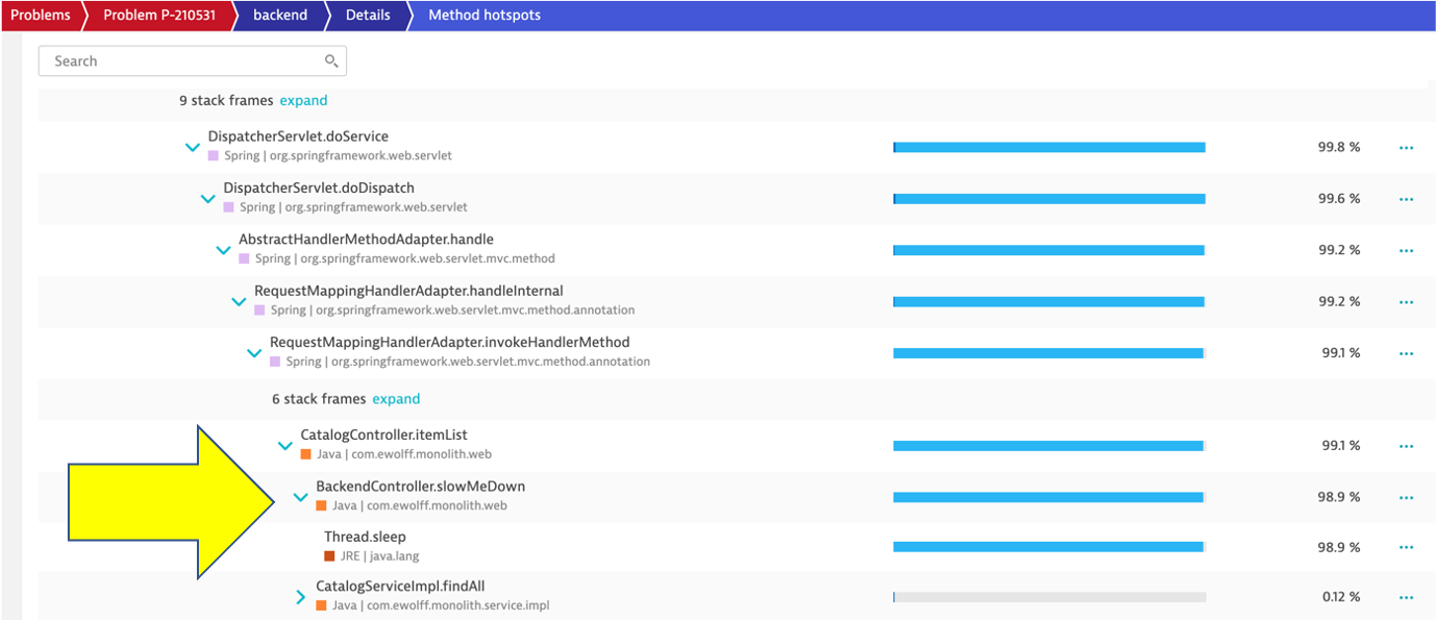
- Analyze problem - hot spots
- Here the code hierarchy breakdown is shown and by expanding this tree, you can locate the method where the slow down is occurring.
- Analyze problem impact
- From the breadcrumb menu, click on the
backendto open the service page.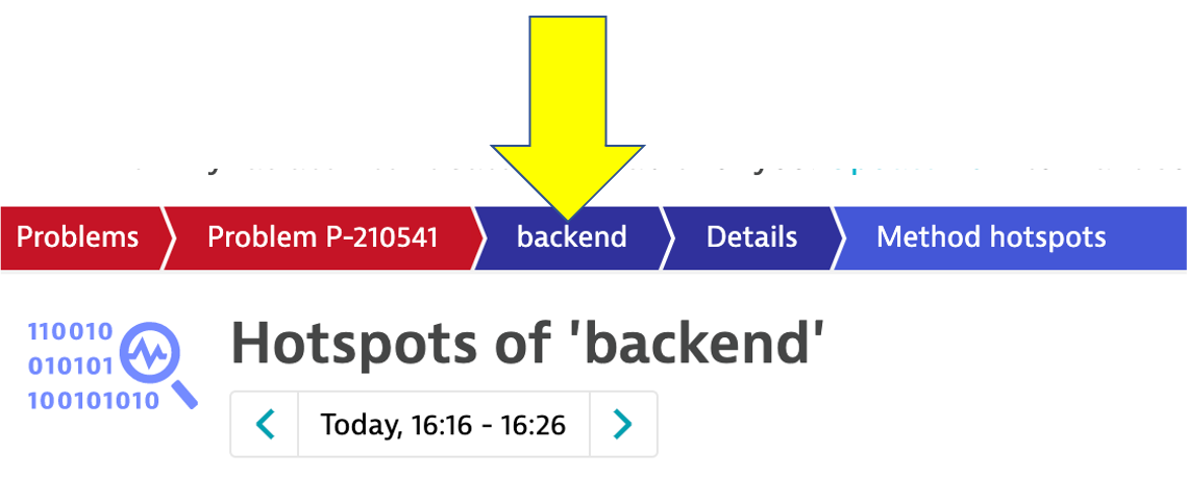
- You can see exactly when the problem started.
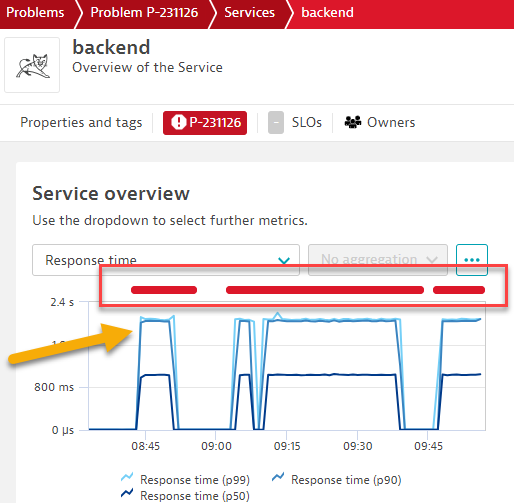
- From the breadcrumb menu, click on the
- Disable the problem pattern
- From the Azure shell run these commands to set the version back to version 1
cd ~/azure-modernization-dt-orders-setup/learner-scripts ./set-version.sh backend 1 - Ensure there are numerical values at the end for
Response Data: storedEventIdslike:Response Data {"storedEventIds":[8663164135574257870,-5988376401319068441],"storedIds":["8663164135574257870_1628095127627","-5988376401319068441_1628095127627"],"storedCorrelationIds":[]} - By ensuring there are numberical values t the end, it validates the command ran sucessfully.
In this step we are going to "simulate" another deployment of new version of the order service running on Kubernetes. After the "deployment" the service will exhibit a failures for all requests.
Tasks to complete this step
- Enable the problem pattern use the automated unix script that is provided which will do the following:
- Call the
order/set-versionURL to set the order-service version - Send a Dynatrace
CUSTOM_DEPLOYMENTevent indicating the change - From the Azure shell run these commands to set the version:
Ensure there are numerical values at the end forcd ~/azure-modernization-dt-orders-setup/learner-scripts ./set-version.sh k8-order 3Response Data: storedEventIdslike:Response Data {"storedEventIds":[8663164135574257870,-5988376401319068441],"storedIds":["8663164135574257870_1628095127627","-5988376401319068441_1628095127627"],"storedCorrelationIds":[]}
- Call the
- Validate the Change in Dynatrace
- From the left side menu, navigate to the
Releasespage. Here you will see how Dynatrace detected the versions of monitored processes. It may take a minute, but you will see the version change in theReal-time inventorysection and a new event in theRelease eventssection.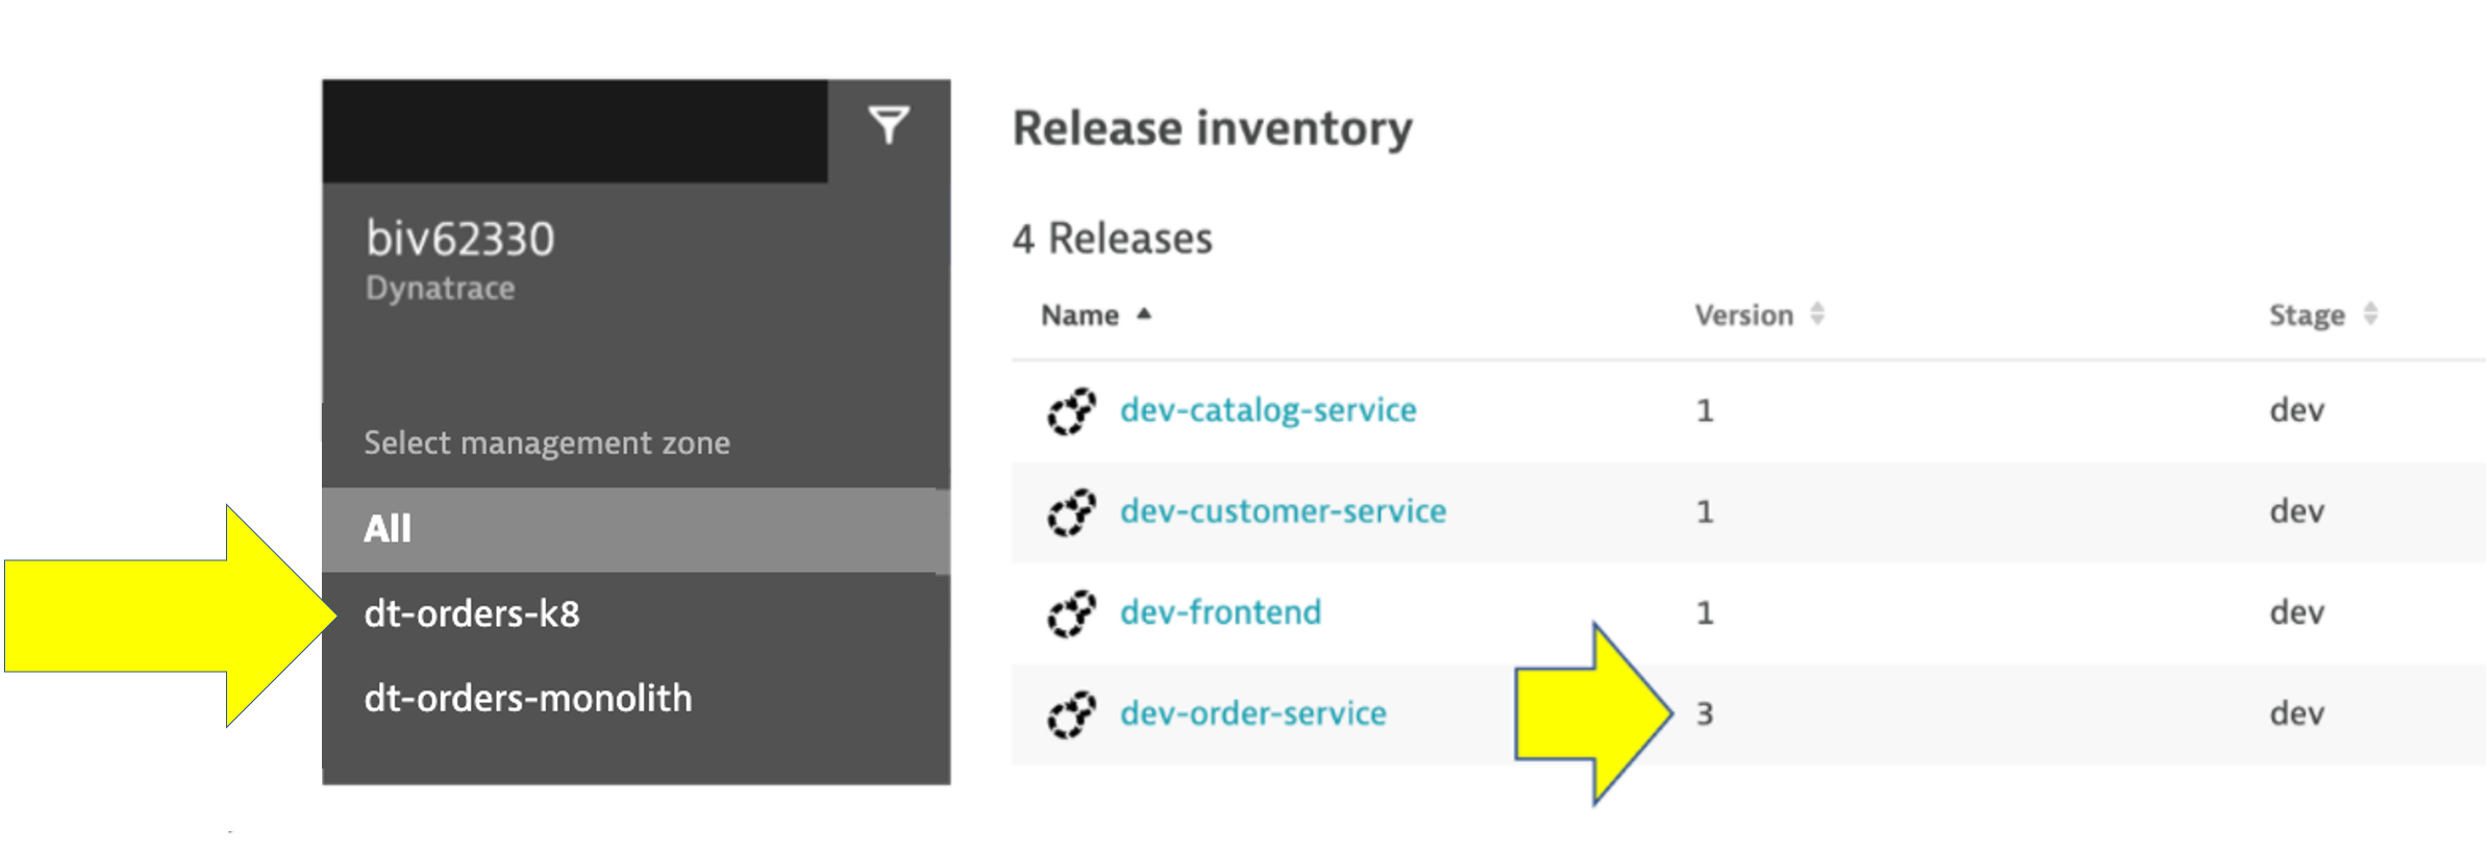
- If you expand the event, you should see something like this
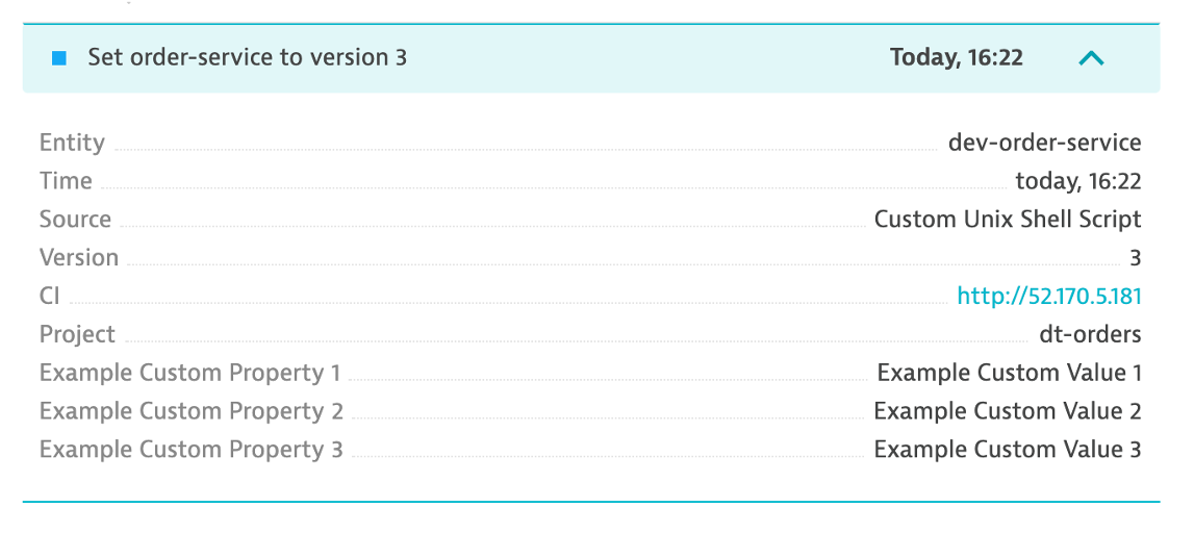
- From the left side menu, navigate to the
- Validate Sample App in Browser
- The event above has the URL back to the sample application, so just click that if you don't have the sample app up already. You should see
version 3for the order app now too.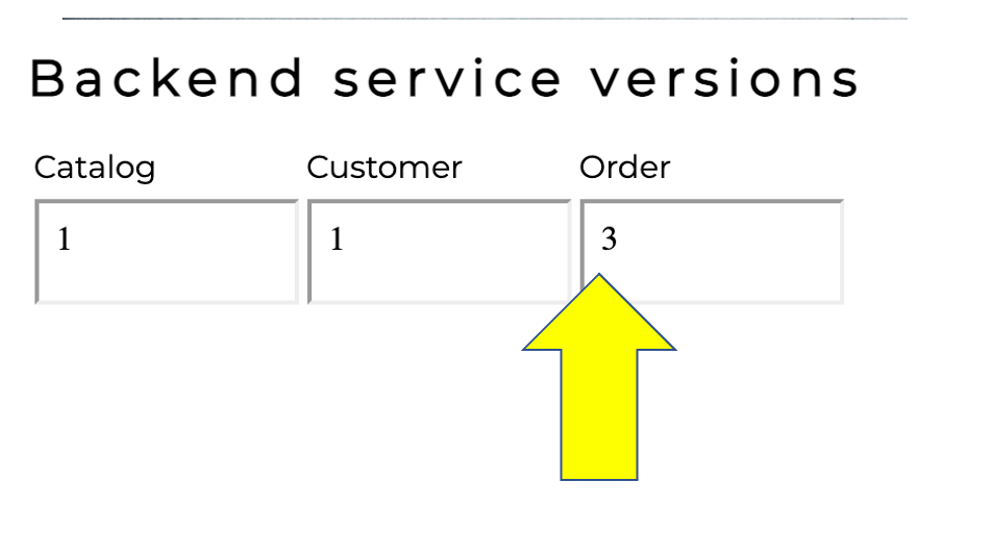
- The event above has the URL back to the sample application, so just click that if you don't have the sample app up already. You should see
- Review the Problem in Dynatrace
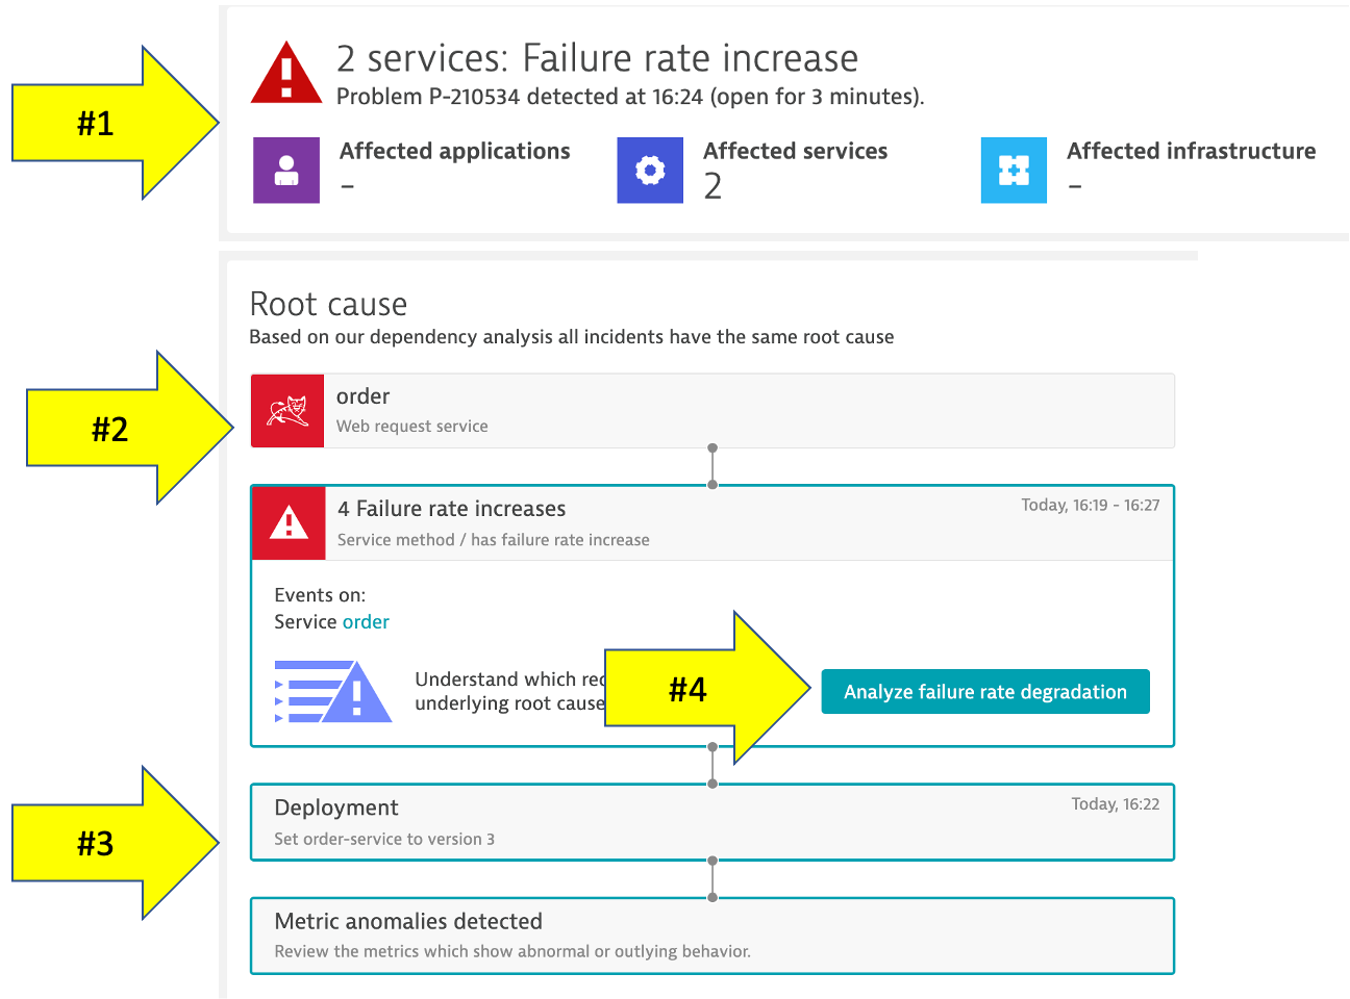
- The problem may take a minute to show up, but this is what the problem will look like once it does. Also, you may see two problems that eventually get merged into one as Dynatrace is performing the problem analysis.
- Problem card windows and impact summary
- Root cause
- Deployment event as additional context
- The problem may take a minute to show up, but this is what the problem will look like once it does. Also, you may see two problems that eventually get merged into one as Dynatrace is performing the problem analysis.
- Analyze problem
- Referring to #4 in the picture above, click on the
Analyze failure rate degradationbutton. - Right away we can see that there were exceptions in the code and the
detailsbutton can be clicked to see the code stack trace.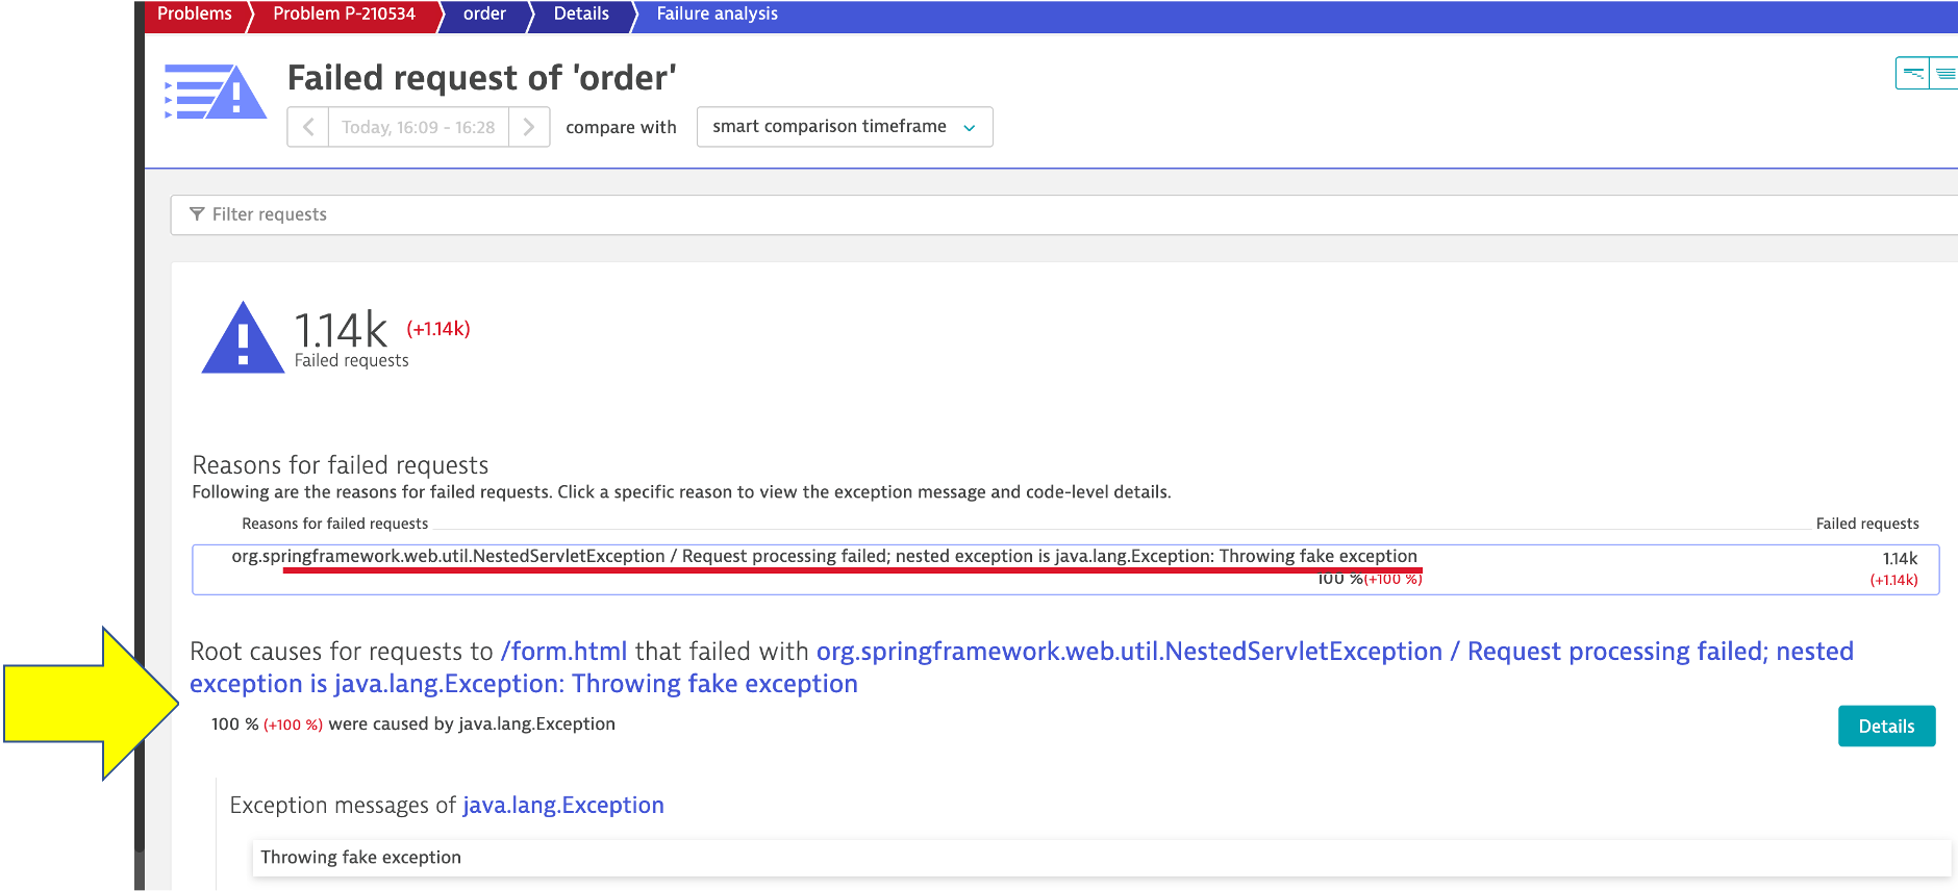
- Referring to #4 in the picture above, click on the
- Analyze problem impact
- From the breadcrumb menu, click on the
orderto open the service page.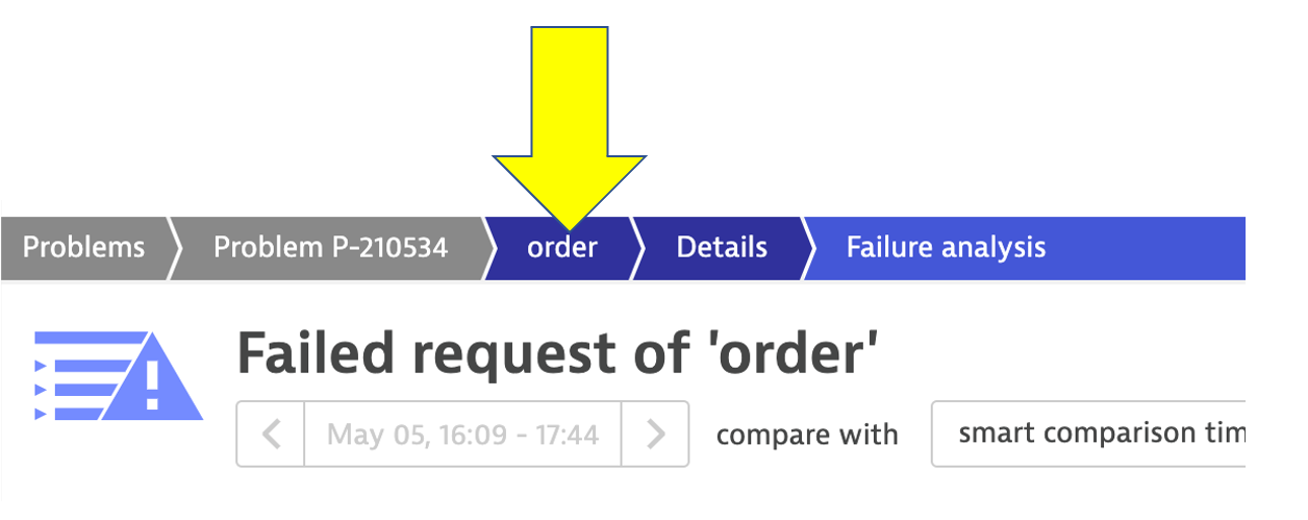
- Then click on the failure rate box to open the service details page. You can see exactly when the problem started.
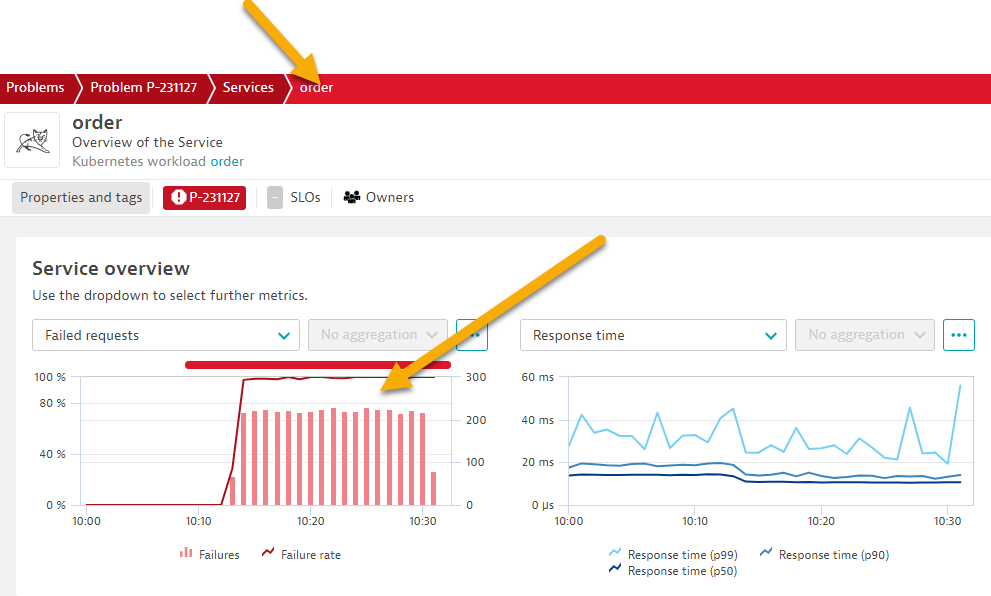
- From the breadcrumb menu, click on the
- Disable the Problem Pattern
- From the Azure shell run these commands to set the version back to version 1
cd ~/azure-modernization-dt-orders-setup/learner-scripts ./set-version.sh k8-order 1 - Ensure there are numerical values at the end for
Response Data: storedEventIdsare like:Response Data {"storedEventIds":[8663164135574257870,-5988376401319068441],"storedIds":["8663164135574257870_1628095127627","-5988376401319068441_1628095127627"],"storedCorrelationIds":[]} - Dynatrace will automatically close the problem once it detects things are back to normal.
- From the Azure shell run these commands to set the version back to version 1
In this section, you should have completed the following:
✅ Enabled a problem in the application and walk through what Dynatrace Davis found
✅ Reviewed the details of the Dynatrace Prolem card.
✅ Learn how Dynatrace use Events and Tags to provide additional context.