🔷 Examine Dynatrace Service Level Objectives (SLOs)
🔷 Create a custom dashboard with SLOs
Dynatrace provides all the necessary real-time information that your Site-Reliability Engineering (SRE) teams need to monitor their defined objectives.
An SRE team is responsible for finding good service-level indicators (SLIs) for a given service in order to closely monitor the reliable delivery of that service. SLIs can differ from one service to another, as not all services are equally critical in terms of time and error constraints.
Dynatrace offers more than 2000 different metrics that are ready for use as dedicated SLIs.
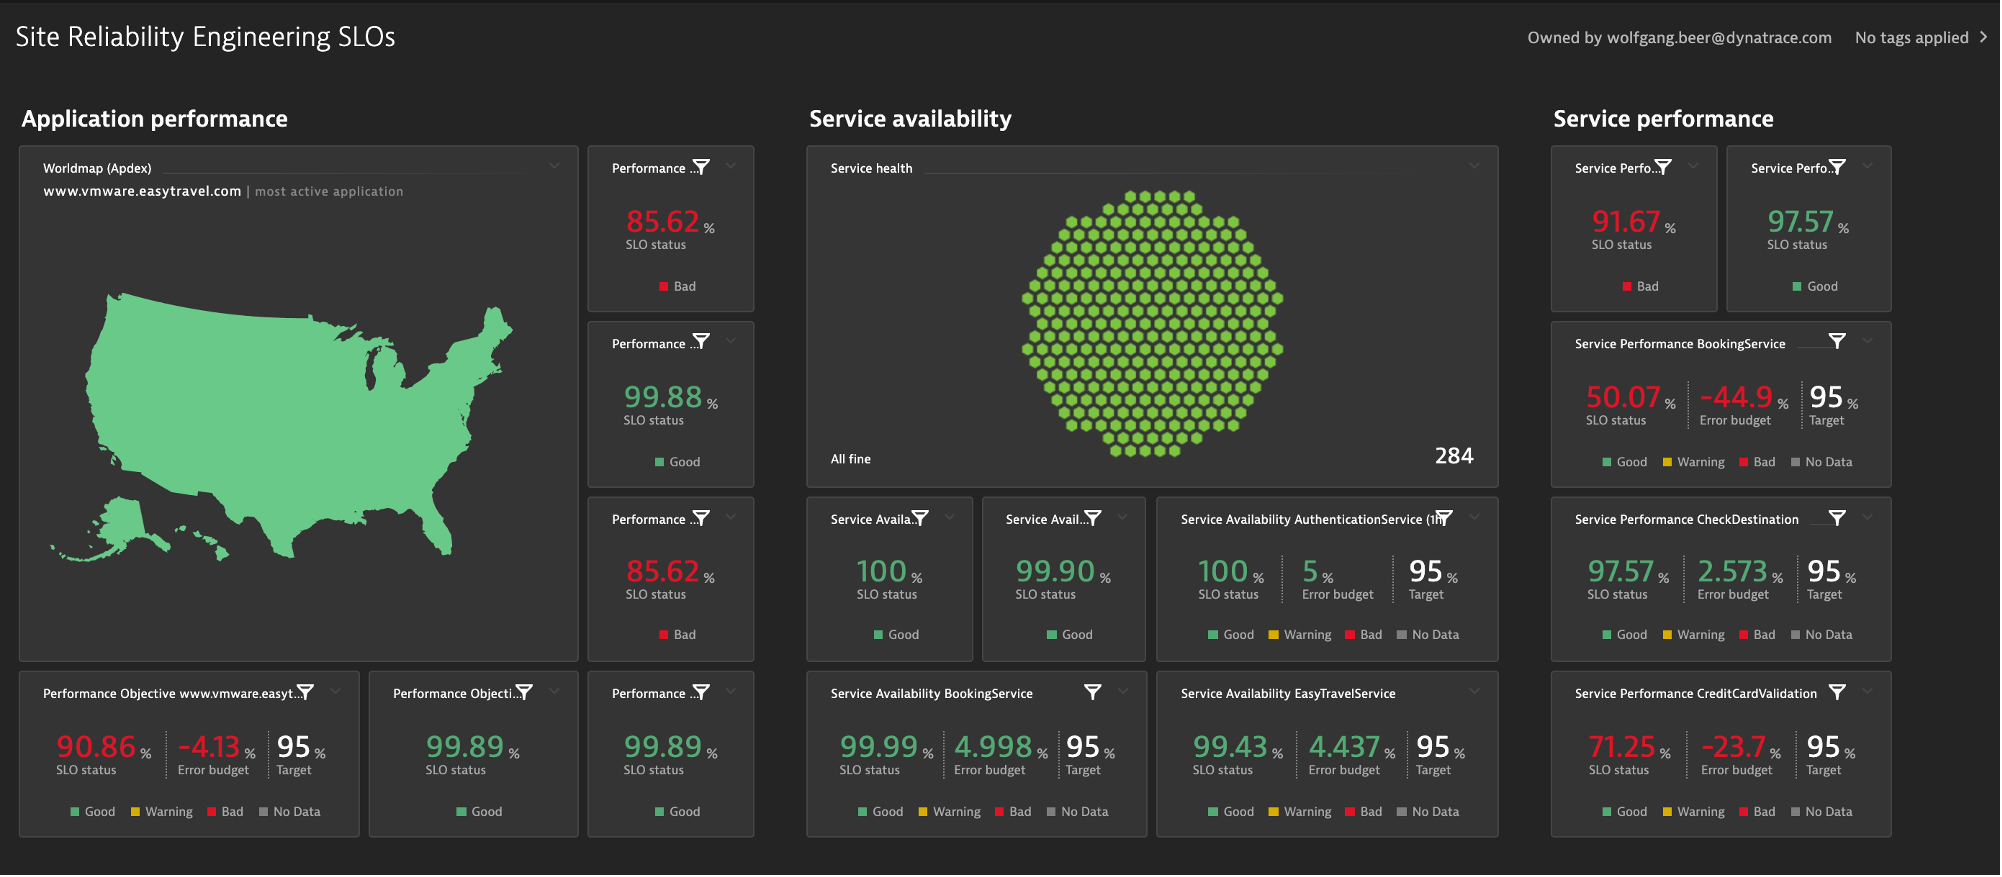
Each Service Level Objective (SLO) definition can be evaluated by following two result metrics:
- SLO status: The current evaluation result of the SLO, expressed as a percentage. The semantics of this percentage (for example, 99.3% of all service requests are successful, or 99.99% of all website users are "satisfied" in terms of Apdex rating) and the target defined for this percentage are up to the SRE team.
- SLO error budget: The remaining buffer until the defined SLO target is considered as failed. For example, if an SLO defines a 95% target and its current SLO status is evaluated as 98%, the remaining error budget is the difference between the SLO status and the SLO target. Two SLOs were created for you, so review those.
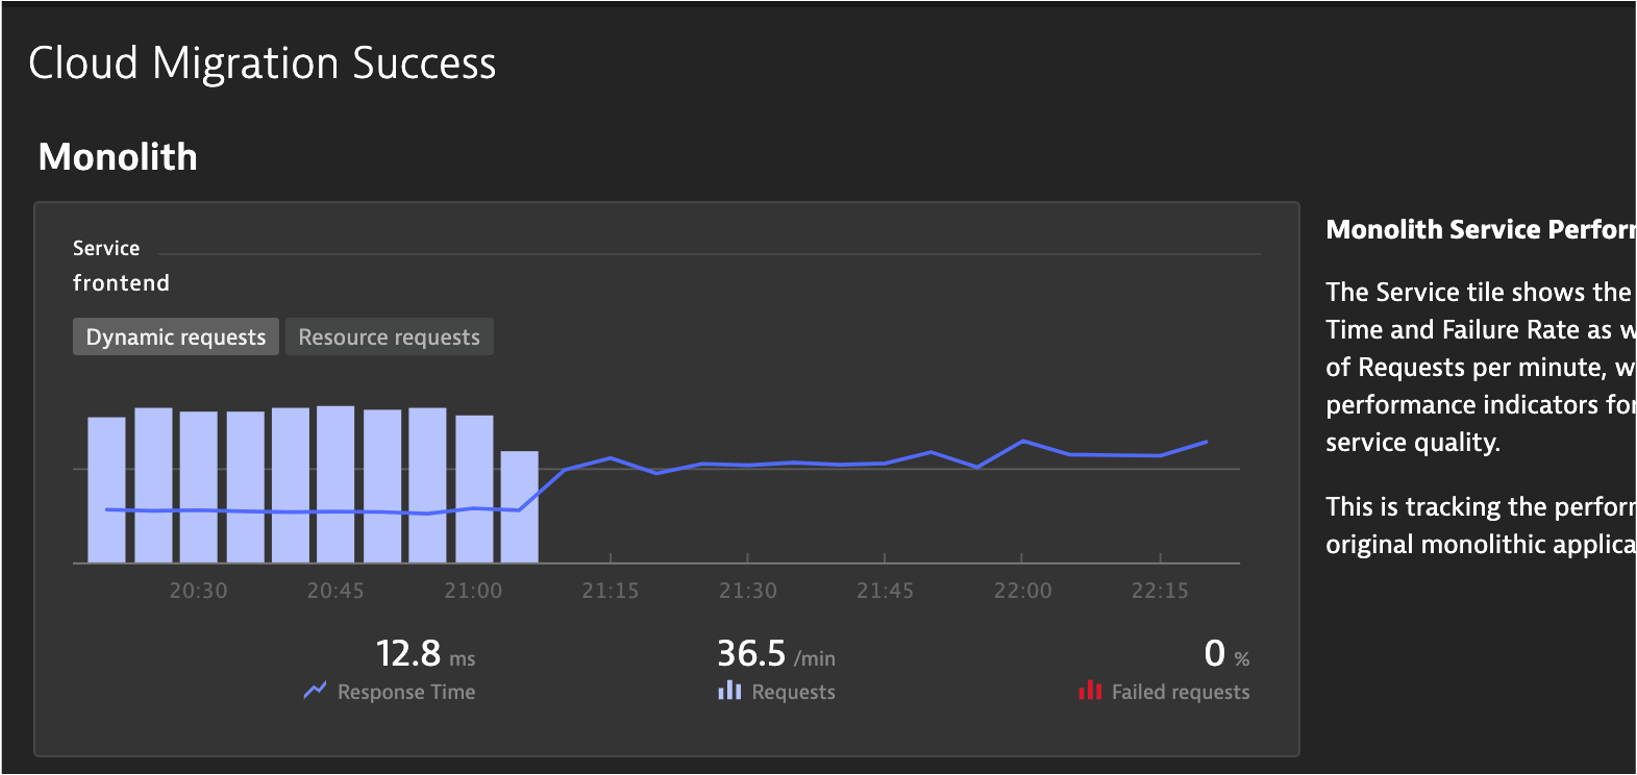
Here is an example custom dashboard with SLO dashboard tiles.
Tasks to complete this step
- Review SLO's are deployed
- From the left menu in Dynatrace, click the
Service Level Objectiveoption to review the two SLOs that are already setup. Edit one of them to review the configuration.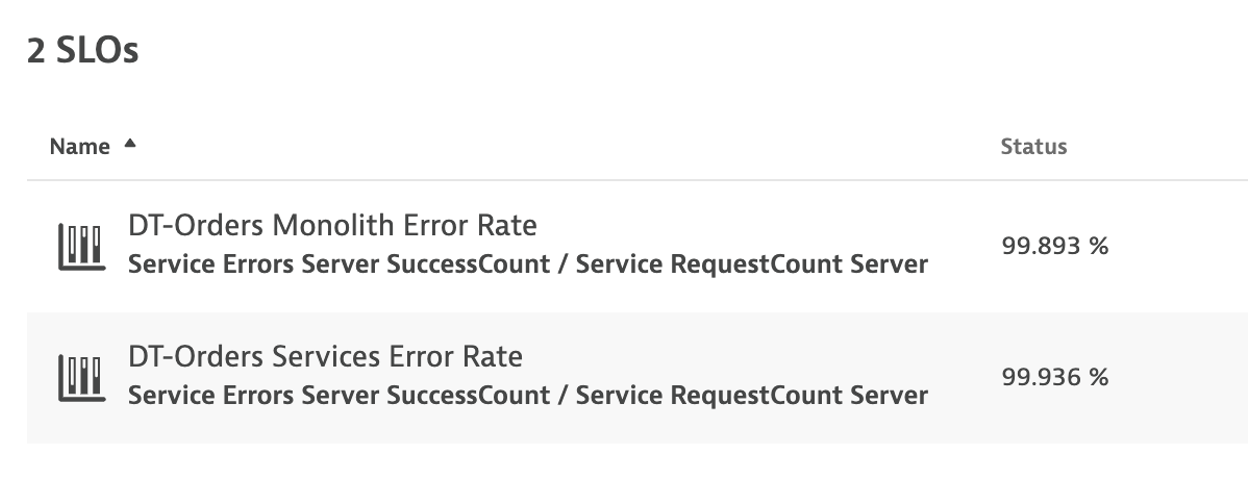
- From the left menu in Dynatrace, click the
In this step we'll create a very basic SLO dashboard to compare the before and after migration SLO's we've defined for our Monolith and Kubernetes service.
Tasks to complete this step
- Create Dashboard
- From the left side menu in Dynatrace, pick the
dashboardmenu. - On the dashboard page, click the
new dashboardbutton.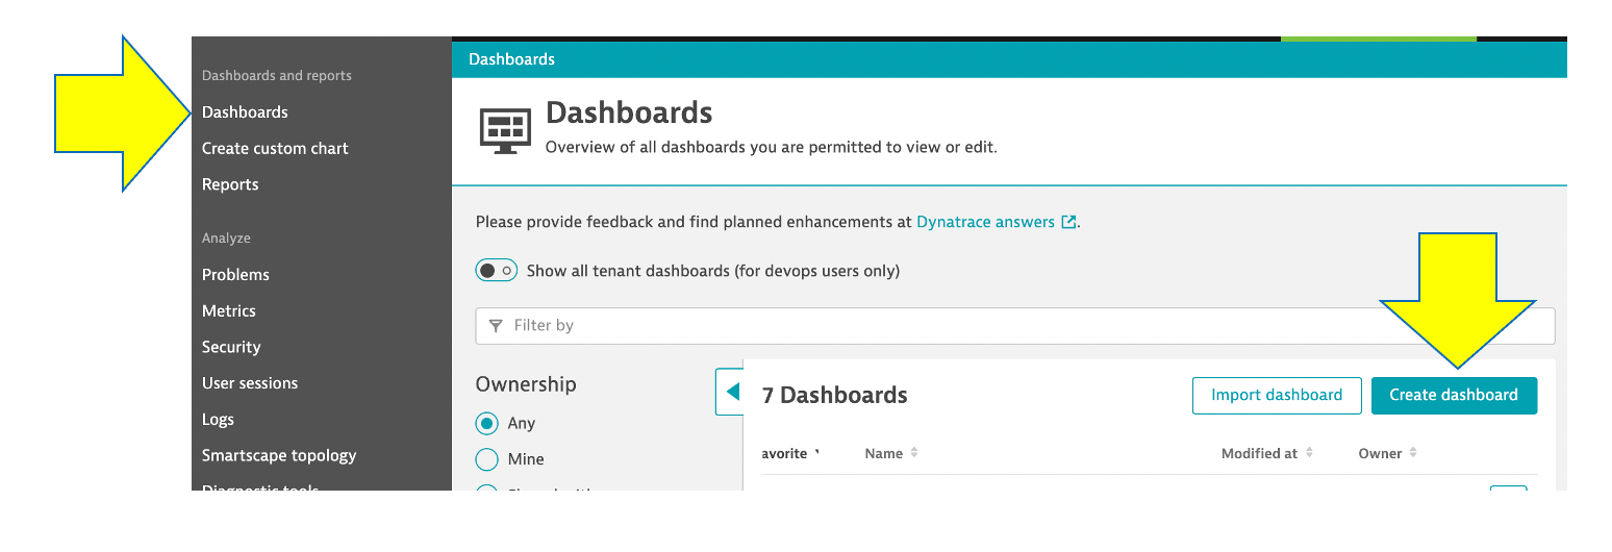
- Provide a dashboard name like
Cloud Migration Success - On the blank dashboard page, click the settings. Then click the
Configure morelink to open then settings page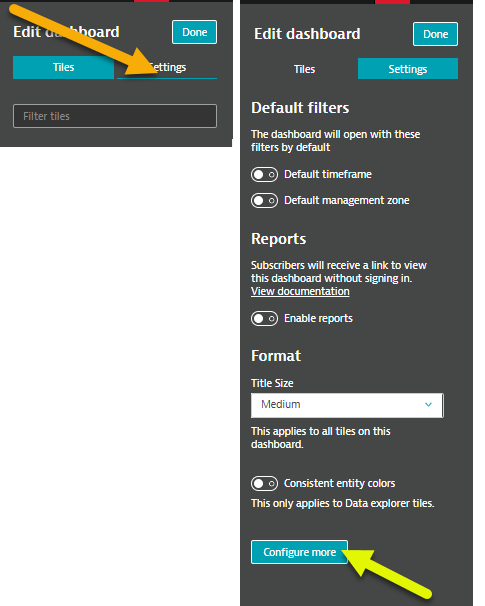
- Referring to this picture, follow these steps:
- On the settings page, click the
dashboard JSONmenu. - Copy and paste the following Json content from this file into your dashboard JSON, replacing the existing JSON in the process:
- You MUST replace the
ownerfield to be the email that you logged into Dynatrace with or you will not be able to view it.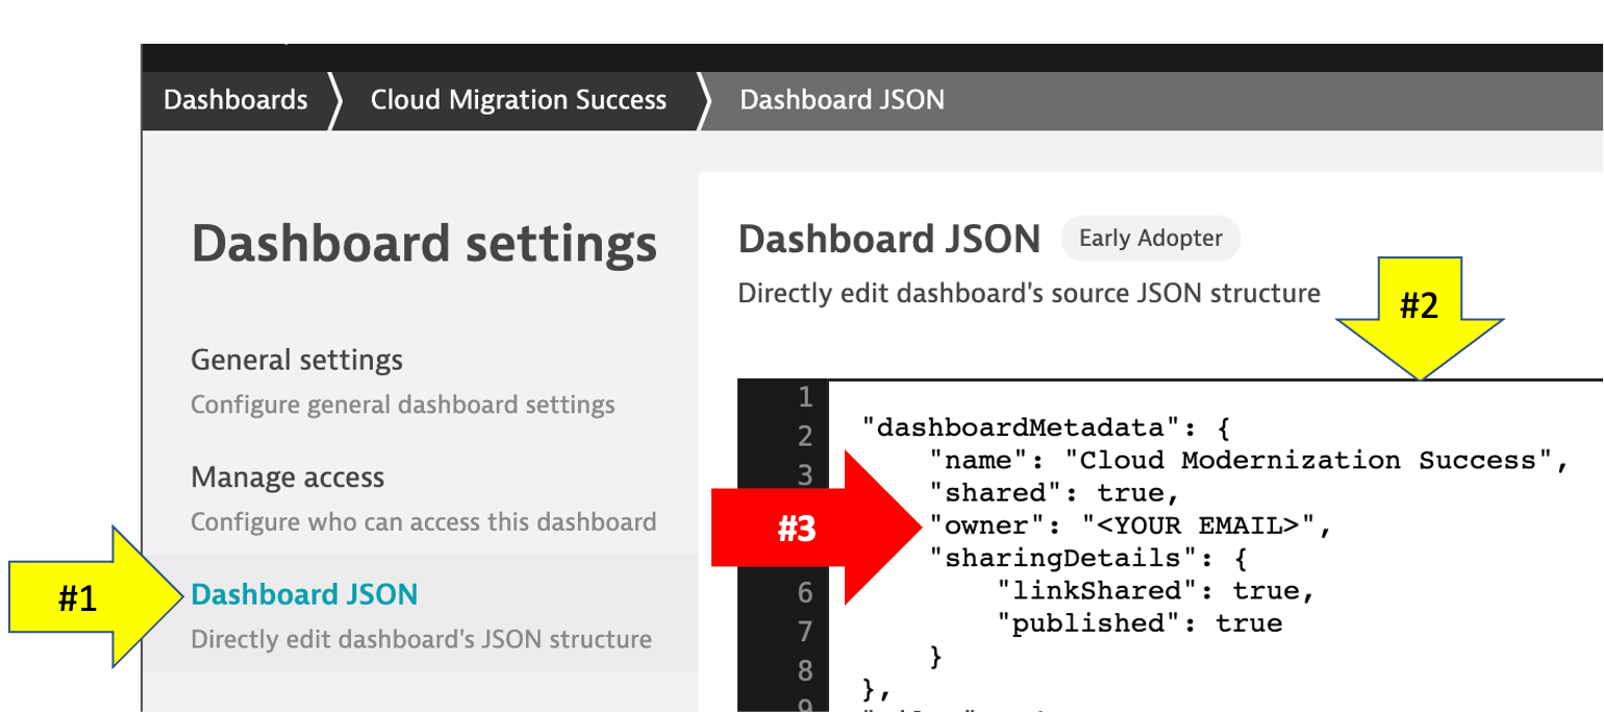
- After you edit the email, then click the
Revert Dashboard IDbutton. After you click theRevert Dashboard IDbutton, click theSave changesbutton.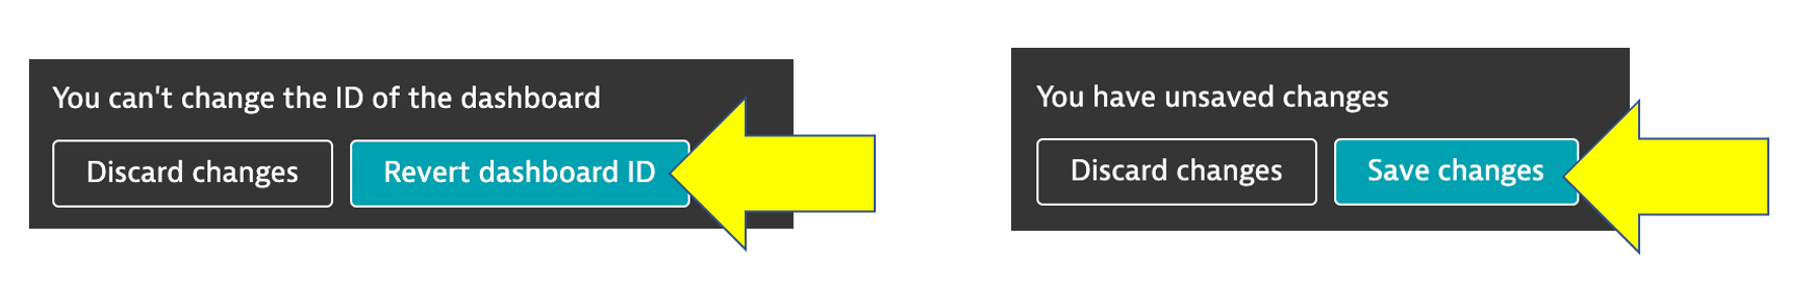
- On the settings page, click the
- From the left side menu in Dynatrace, pick the
- View Dashboard
- Click the
Cloud Migration Successbreadcrumb menu to go back to the dashboard page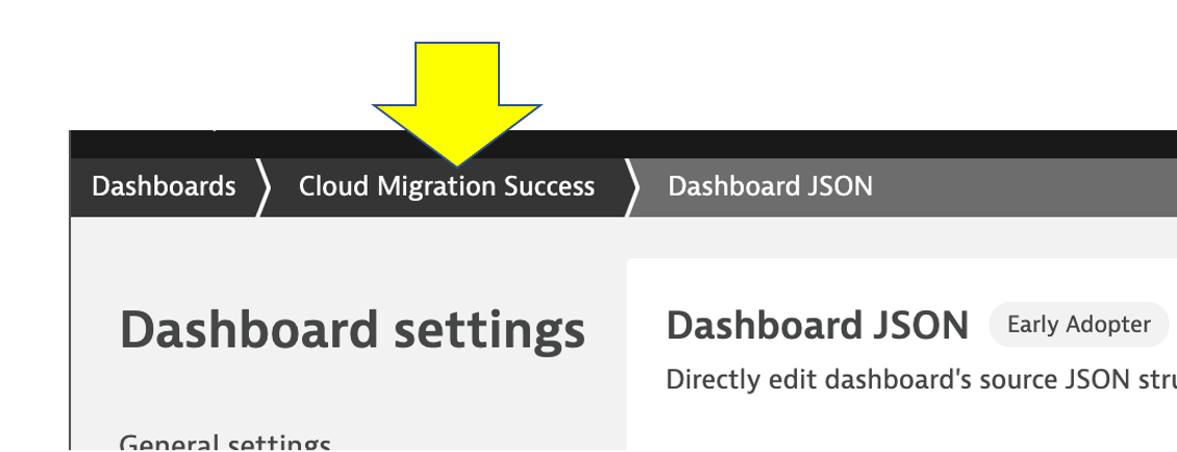
- You should now see the dashboard
- Click the
- Edit Dashboard
- Now you need to edit the dashboard and adjust the tiles with the SLOs and databases in your environment.
- On the top right of the page, click the
editbutton and then follow these steps:- Click on the title of the Dynamic requests tile to open the Service properties window on the right side
- On the Service properties window, pick the monolith
frontend (monolith-frontend)service - Click the
Donebutton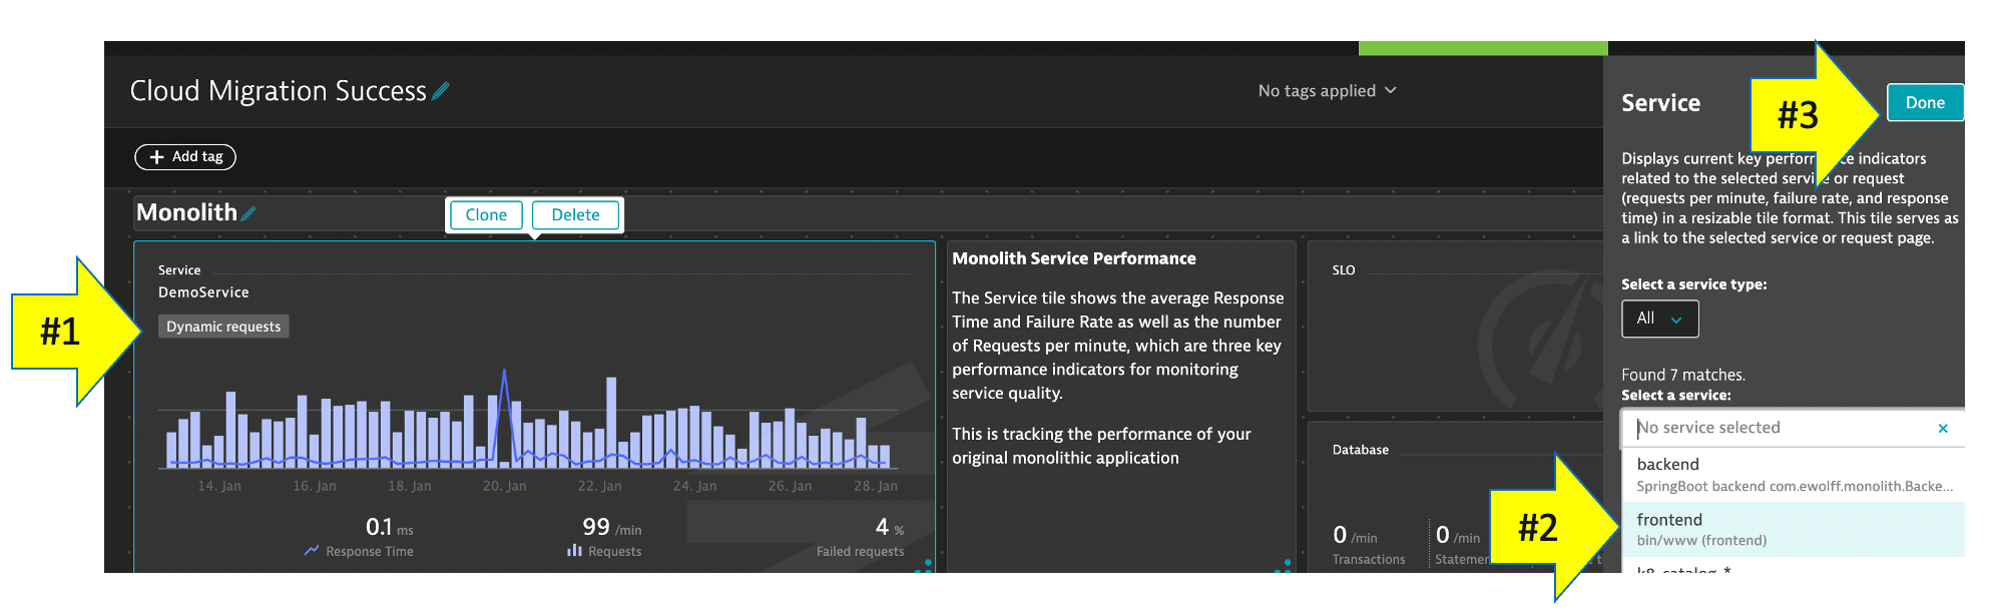
- Edit remaining tiles by following these steps
- Repeat the same steps above for the Cloud services tile, but pick the
staging- frontendin the Service properties window - Repeat for the two SLO tiles, but pick the associated SLO from the drop down list in the SLO properties window
- Repeat for the two database tiles. For Cloud services application there are 3 databases, so just pick one of the database of a demo.
- Click the
Donebutton to save the dashboard
- Repeat the same steps above for the Cloud services tile, but pick the
In this section, you should have completed the following:
✅ Examined Dynatrace Service Level Objectives (SLOs)
✅ Created a custom dashboard with SLOs