One key Dynatrace advantage is ease of activation. OneAgent technology simplifies deployment across large enterprises and relieves engineers of the burden of instrumenting their applications by hand. As OpenShift adoption continues to grow it becomes more important than ever to simplify the activation of observability across workloads without sacrificing the deployment automation that OpenShift provides. Observability should be as cloud-native as OpenShift itself.
In our workshop, we will install the Dynatrace Operator that streamlines lifecycle management. You can read more about it here in this Dynatrace blog. Additionally we will configure ingestion of Kubernetes events and view this information in the Dynatrace UI.
Organizations will often customize the Dynatrace Operator installation and you can read more about the options in the Dynatrace docs but, we are going to use a single command that we can get from the Dynatrace interface to show how easy it is to get started.
When we run this command, it will do the following:
- Create a namespace called
dynatracein your cluster will the Dynatrace Operator pods - Set the OneAgent on each of the cluster nodes as to provide full-stack Dynatrace monitoring
- Create a Kubernetes dashboard that will be populated with the Kubernetes data pulled from the API
- Setup a Dynatrace ActiveGate that runs as a container in the
dynatracenamespace that is used in the polling of Kubernetes API - Enable preset out-of-the-box Kubernetes dashboards
Install Dynatrace Operator
- To navigate to OpenShift/Kubernetes page, follow these steps and refer to the picture below:
- Within Dynatrace, click on the
Deploy Dynatracemenu item. - Click on the
Start Installationbutton - Click on the
OpenShiftbutton

- Within Dynatrace, click on the
- To get the customized dynakube YAML and the Dynatrace Operator installation command, refer to the steps and pictures below:
- On the Kubernetes configuration page, enter
openshift-workshopfor the name. This is not the cluster name, it will show up as the Kubernetes page name in Dynatrace - Next to Dynatrace Operator Token, Click the
Create tokenbutton - Next to Data ingest token, Click the
Create tokenbutton - Select the
Skip SSL Certificate Checkto be ON - Click the
Download dynakube.yamlbutton
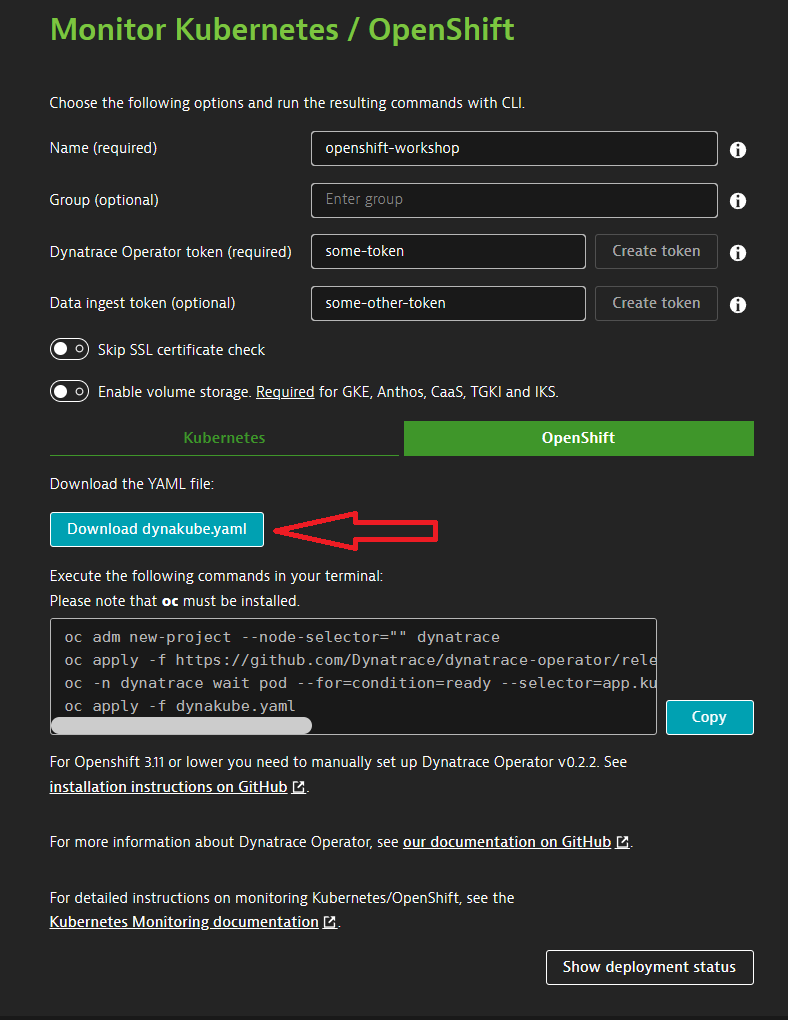
- On the Kubernetes configuration page, enter
- We will need to copy the contents of the dynakube.yaml to your Butterfly console
- Open the dynakube.yaml file with the text editor of your choice
- Select-all and select copy
- Within Butterfly, type (or paste) the following command
vi dynakube.yaml - Hit the
ikey on your keyboard to put vi in insert mode - Hit ctrl-shift-v to paste your clipboard contents into Butterfly
- Hit Escape to put vi in command mode
- Type
:wq!to save your file and exit vi
- Deploy the Dynatrace operator
- Back at the Dynatrace
Monitor Kubernetes / Openshift, click thecopybutton to load the deployments commands to your clipboard - Within Butterfly, paste the deployment commands from your clipboard (ctrl-shift-v)
- Back at the Dynatrace
- Once the script is complete, then monitor the installation until you all pods are in
Runningstate.
Rerun the command (or use watch:oc -n dynatrace get podsoc -n dynatrace get pods -w) until the output looks like this:NAME READY STATUS RESTARTS AGE dynakube-classic-2rk9z 1/1 Running 0 2m14s dynakube-classic-4tlcj 1/1 Running 0 2m14s dynakube-classic-lz7r6 1/1 Running 0 2m14s dynakube-classic-m7z87 1/1 Running 0 2m14s dynakube-classic-tzcsl 1/1 Running 0 2m14s dynakube-classic-wm2h6 1/1 Running 0 2m14s dynakube-kubemon-0 1/1 Running 0 2m22s dynakube-routing-0 1/1 Running 0 2m14s dynatrace-operator-7cf8964786-7m9k2 1/1 Running 0 3m1s
Dynatrace Kubernetes Events Ingest is a Dynatrace feature for Kubernetes that allows you to receive events from your cluster within Dynatrace. This allows you to accurately track Kubernetes events within the context of other activities in the cluster and can supply DAVIS with additional context around problems in your cluster provoding for more accurate root cause analysis. This feature is enabled for us automatically by the Dynatrace Operator.
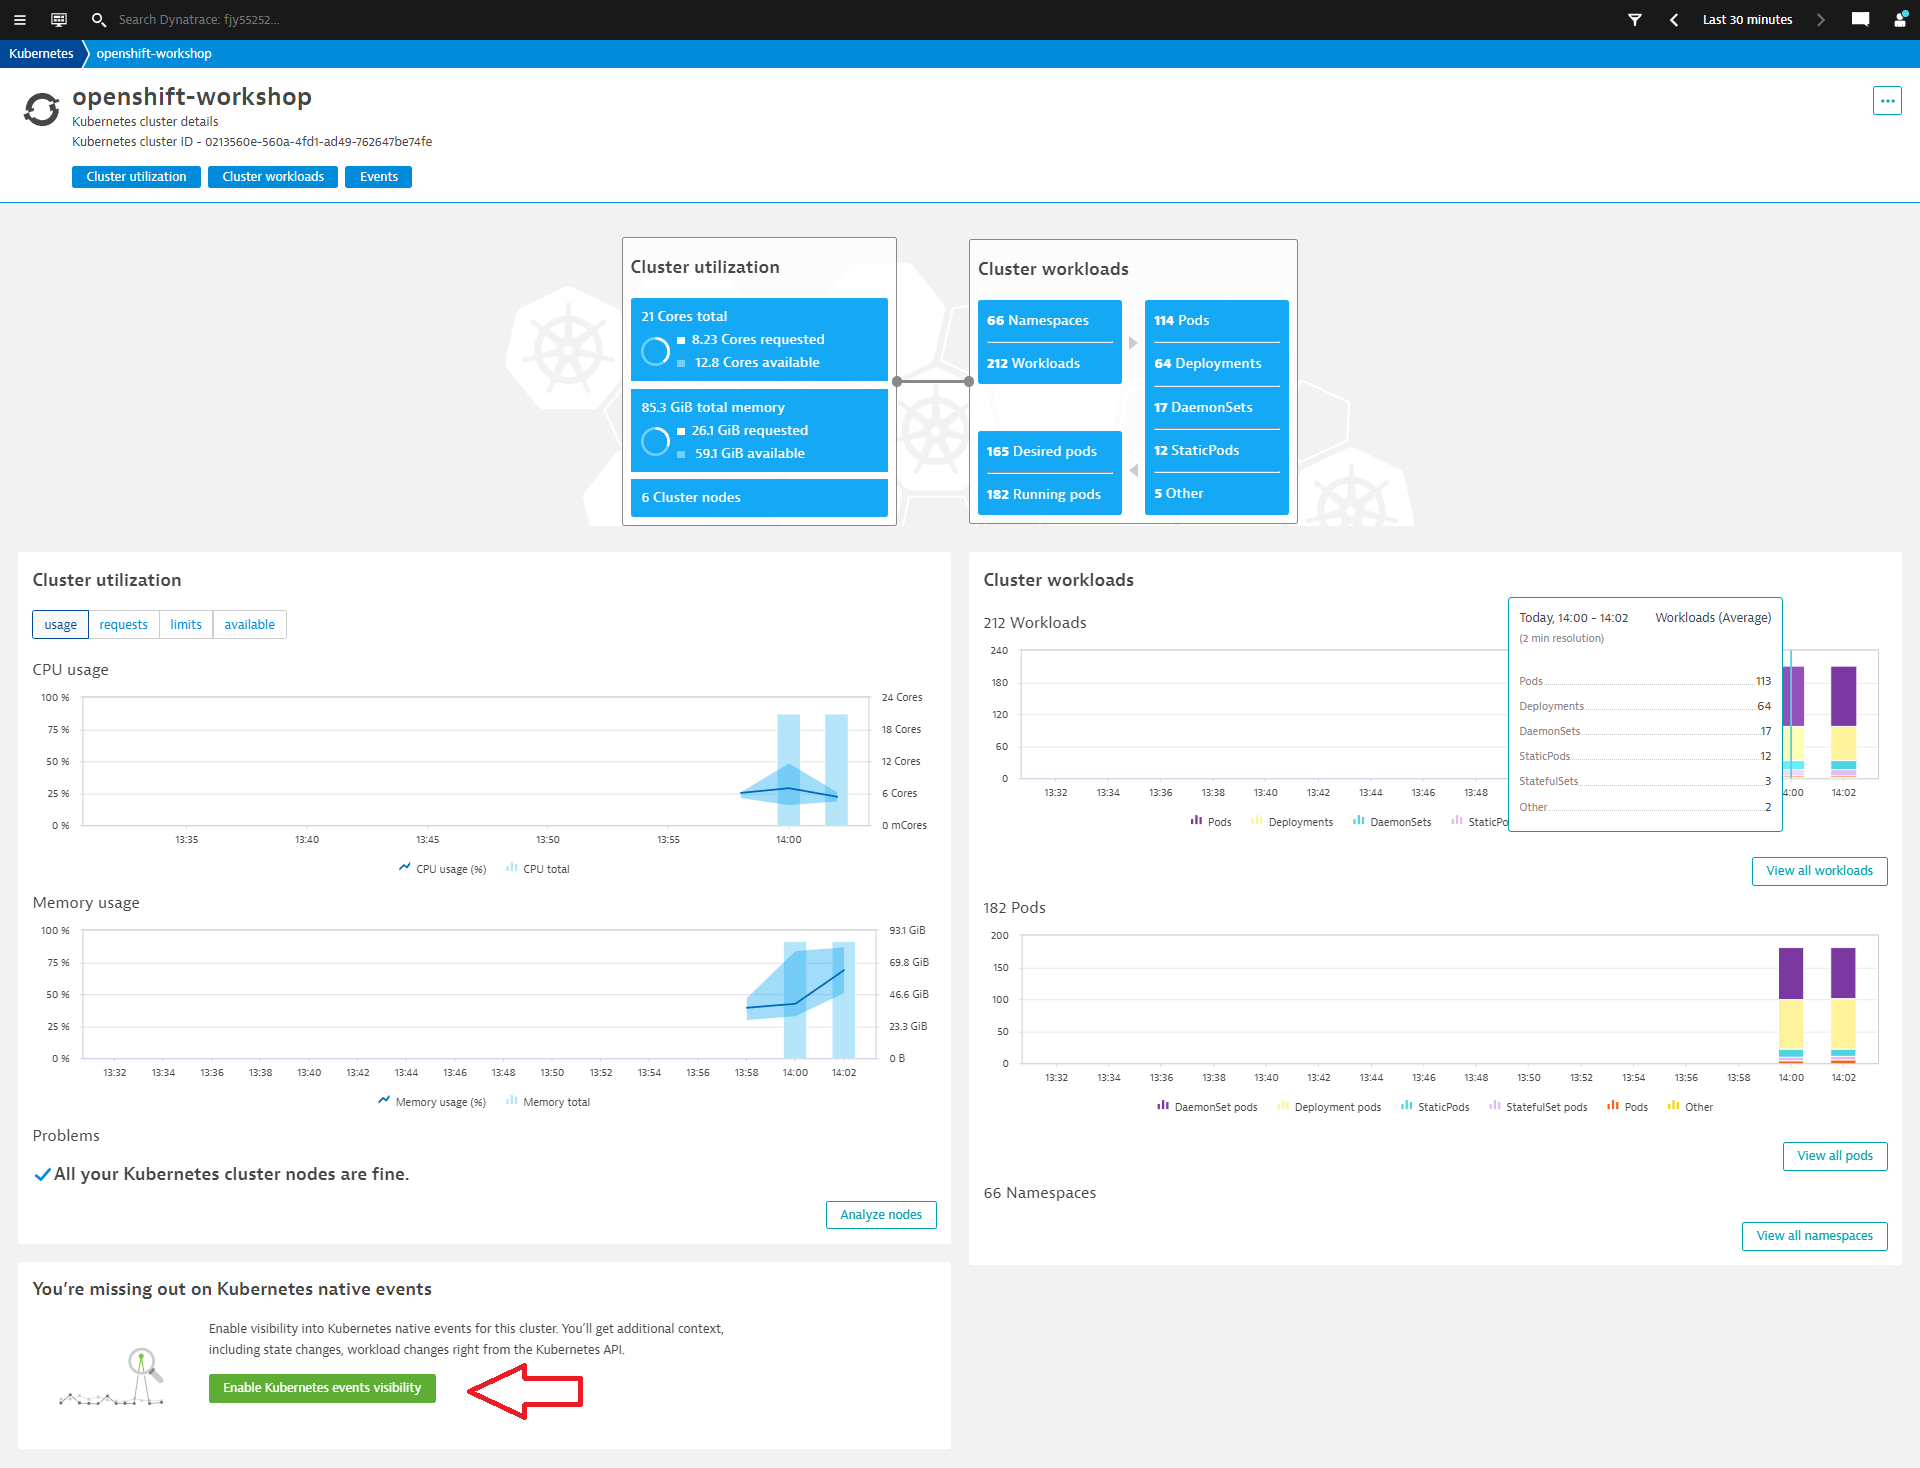
- Navigate to the Dynatrace Kubernetes Overview screen
- Click the green "Enable Kubernetes events visibility" to edit the Dynatrace configuration for your workload cluster.
- Enable "Monitor Events"
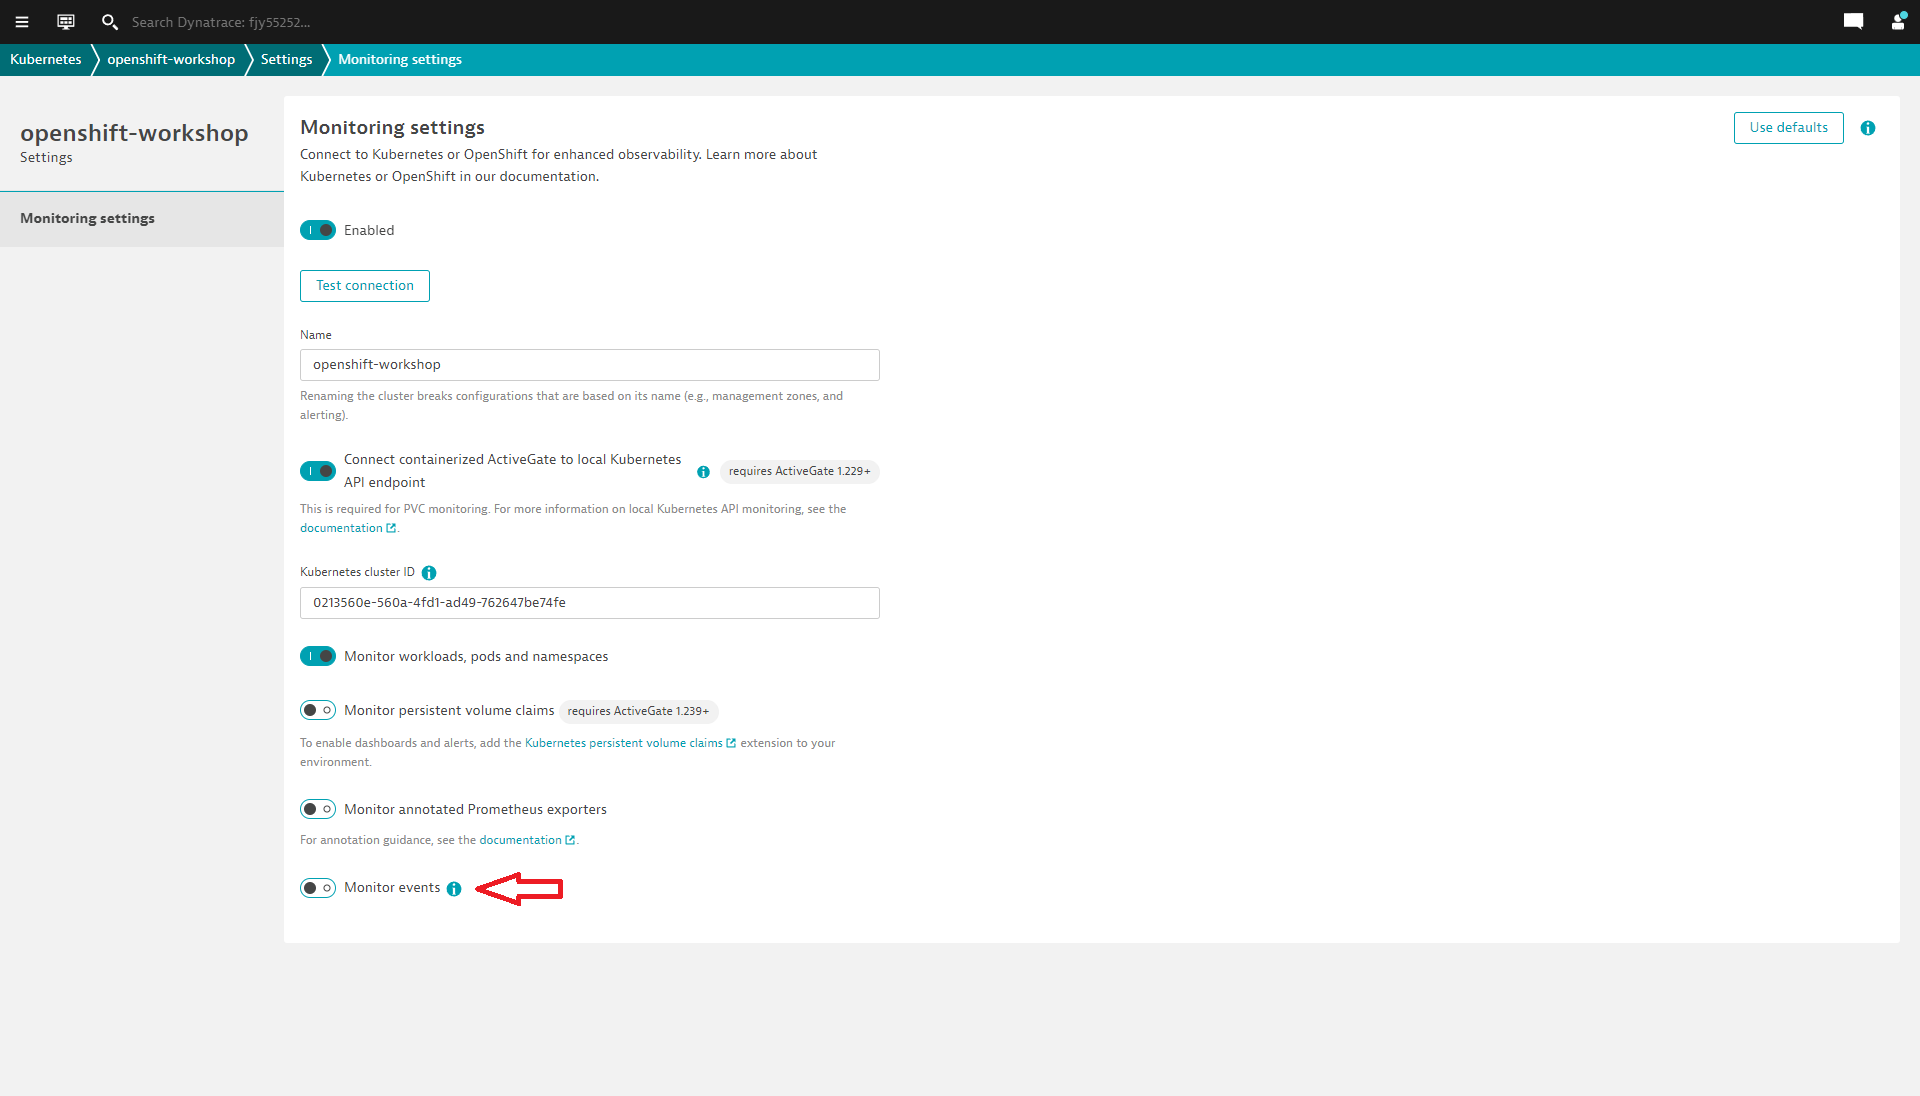
- Click the "Save" button.
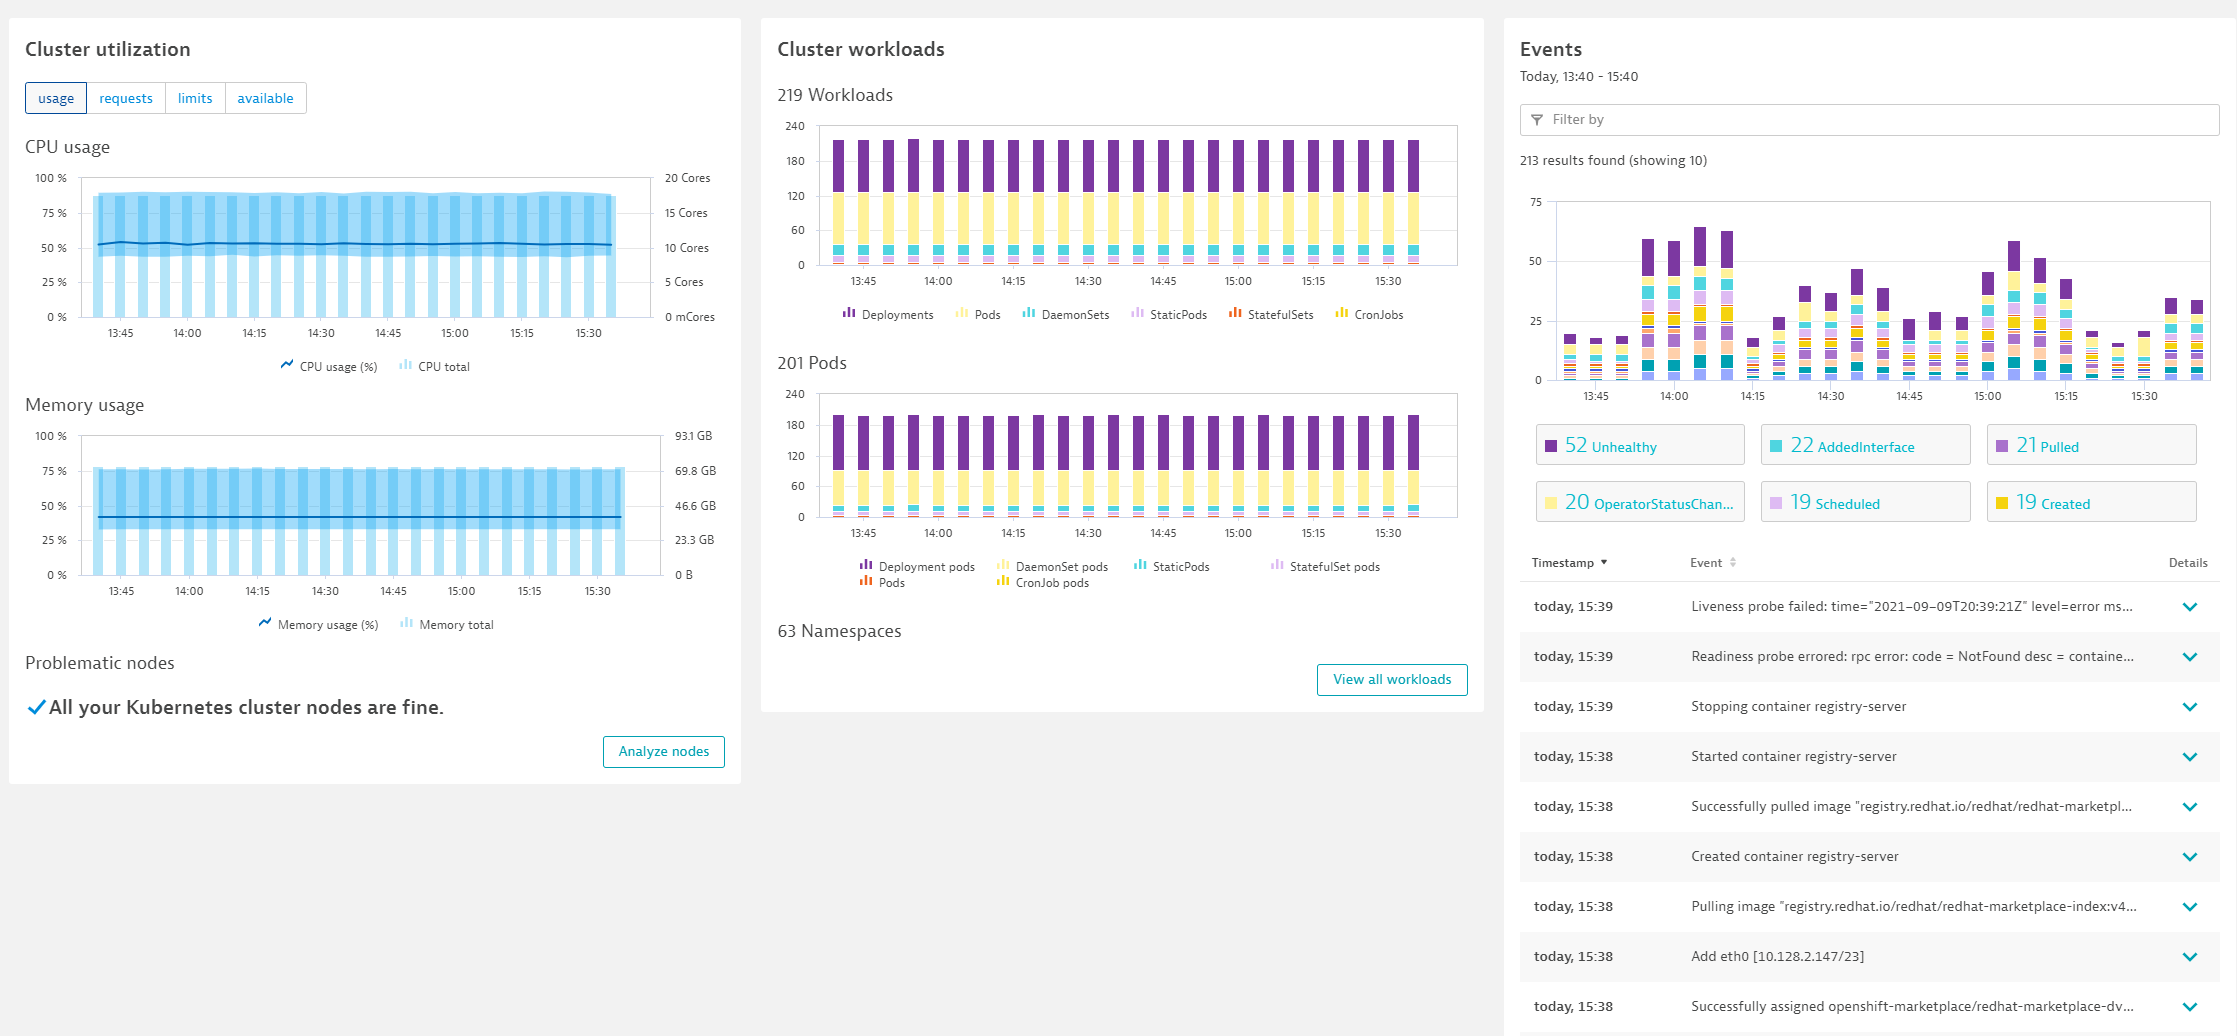
- As our cluster is likely healthy, we might not immediately see any events within the Dynatrace kubernetes overview.
- After some time, we should see events within the Dynatrace Kubernetes overview screen.